Splunk & Phantom - My Journey
Author: Baz Donoghue
Release Date: 17/06/19
Splunk & Phantom - My Journey
Another factor also happens to be that, Like Splunk, Phantom offers a free version!
After attending a Phantom familiarisation session, I was keen to better understand how Splunk and Phantom integrate – Which gave me the perfect excuse…err…reason to integrate Phantom into my Splunk instance at Home.
First things first, we will need a copy of both Splunk and Phantom. This is straightforward, with Splunk offering a free version for download (all you need to do is sign up for a free Splunk account) for various platforms, as well as a free Phantom Community Edition offering in the form on an OVA.
Next we need to install and configure both as per the Splunk and Phantom installation documentation respectively.
Once we have both in a state were we can access the Web GUI for both, we are ready to start integrating the products. Both products have an app available that allows integration with each other. For Splunk there is the “Phantom App for Splunk” and for Phantom…you guessed it… the “Splunk” app for Phantom. The former allows you to carry out searches within Splunk and push the resultant events to Phantom for further actioning. The Latter allows for polling of events, pushing searches to Splunk as well as actions like updating a notable event in Enterprise Security, Splunk’s premium SIEM-like capability. To begin with, I recommend installing the Phantom app for Splunk and get some events sent over to Phantom for further actions. After installing and configuring the app (A simple process that is carried out via a configuration page) we are ready to write a search to capture events to be forwarded to Phantom.
But what events shall we send? What would be a suitable use case for testing? Are there any practical home-based used cases available?
You May Also Like:

Any events whereby additional, dynamic analysis or enrichment is required are suitable use cases, and within my home network. I think I have just the scenario.
We use a third-party Modem and router for our home broadband. This router also has the ability to carry out some level of network protection.
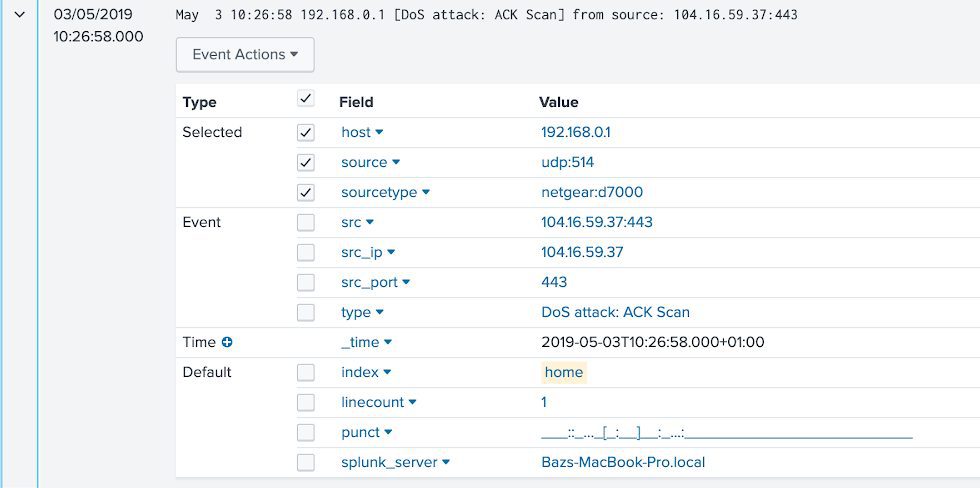
Including detecting what it believes to be Denial of Service attacks (DoS). These are presented in a rather unhelpful logging window, however we do have the ability to forward these events to Splunk via Syslog.
With events from my router now ingesting nicely into Splunk, all we need before sending events to Phantom is to normalise the events to include fields we can pass into what Phantom calls artefacts.

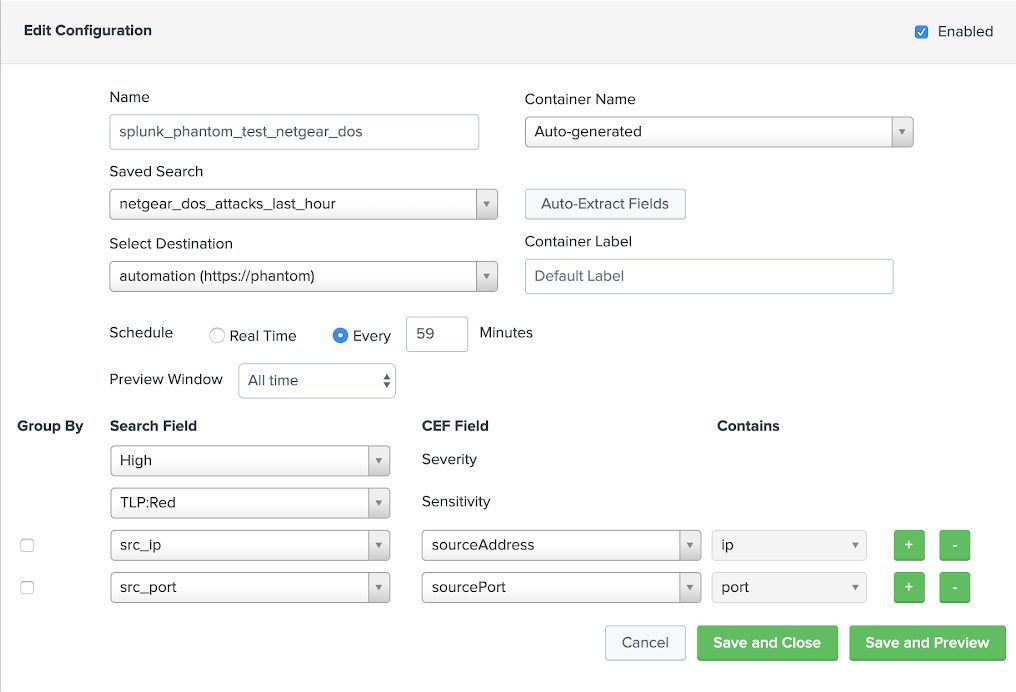
We now have some fields to work with in Phantom. Before a quick setup of the Phantom app for Splunk, we configure a saved search to detect any events of the type “DoS Attack: ACK Scan” which we then configure the Phantom app to export to Phantom.
We select a name for our configuration, choose our saved search, specify out destination and finally we map our Splunk fields to the CEF fields used by Phantom.
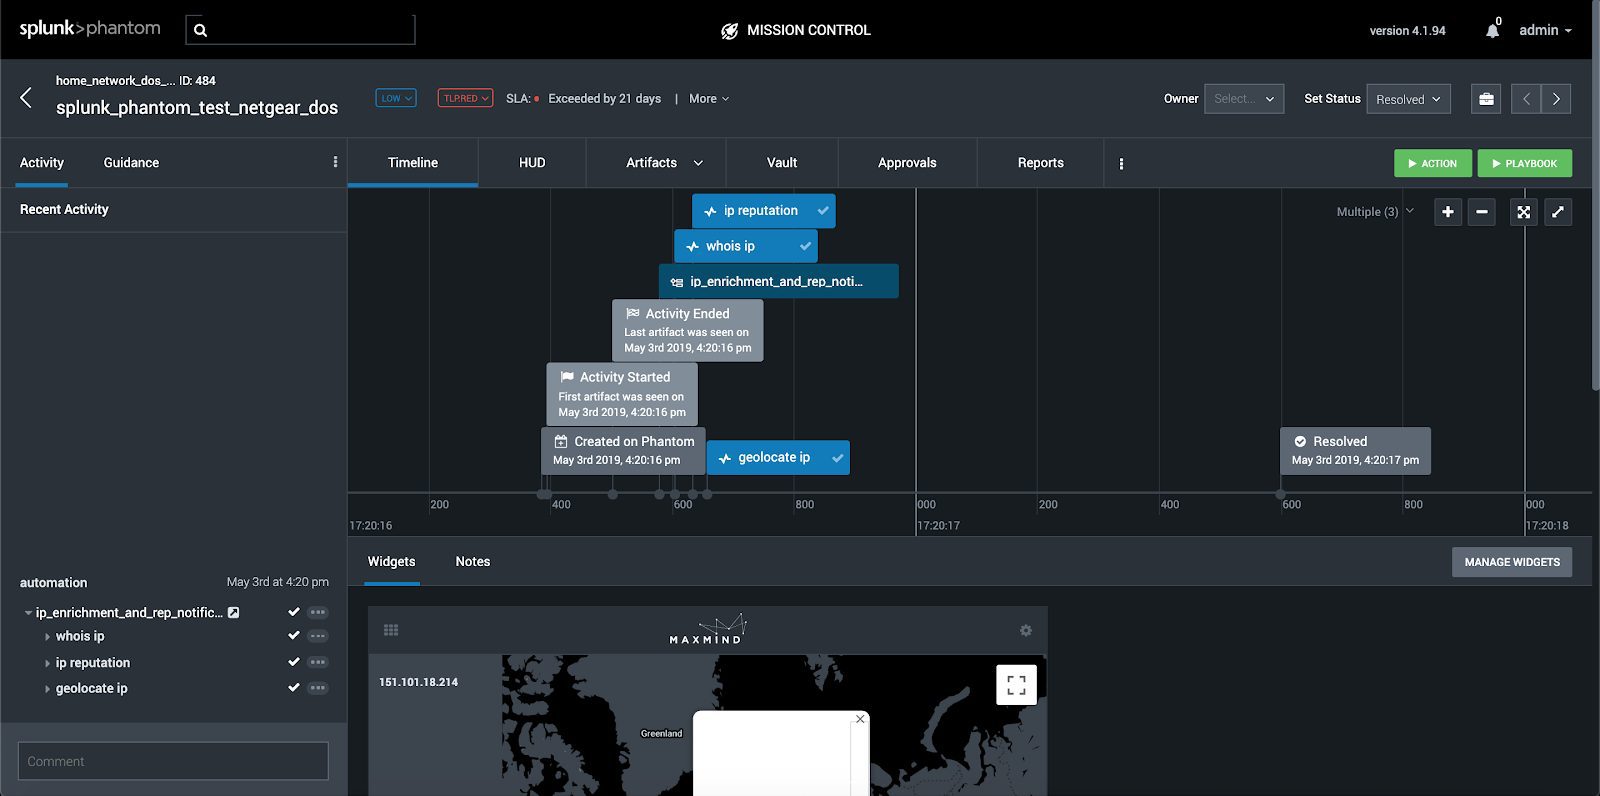
Once the events are within a Phantom “container” we can then begin to carry out some actions against them. In order to do this we need to configure the apps in the Phantom that we would like to use the actions from. I will explain how to achieve this in detail in a later blog, so for now let’s just dive in look at what actions we can now run against our events.
Once everything is place, events will now be sent to Phantom using the schedule chosen.
All of the events captured by the Splunk saved search are associated with DoS attacks. In this instance, we are particularly interested in the source of the “attack. This will enable us to ascertain if the attack is a false positive (i.e. the source is well known, and likely caused by streaming site traffic) or if the attack was genuine. Within the router logs, the source is always represented as an IPv4 address, So some obvious enrichment we can carry out is a WHOIS call on the address to see who it belongs to, a geolocate to find out where it is based in the world, and an IP reputation score, to ascertain if the source is likely to be malicious or not.
As mentioned before Phantom, like Splunk, capitalises on Apps, many of which ship out of the box with the Phantom virtual appliance. Amongst those are three apps of interest to us:


A Playbook is essentially a digitised version of the sequence of actions carried out by security analysis as part of an incident investigation. Sometimes referred to as “Standard Operating Procedures”, Playbooks represent a series of activities usually carried out by a human operator in the course of a security incident, such as carrying out additional checks on IP or URLs, raising tickets in an incident management system, updating block lists on firewalls. They can include actions, such as “get the geolocation of this IP”, as well as filters and decision blocks, or even call other Playbooks.
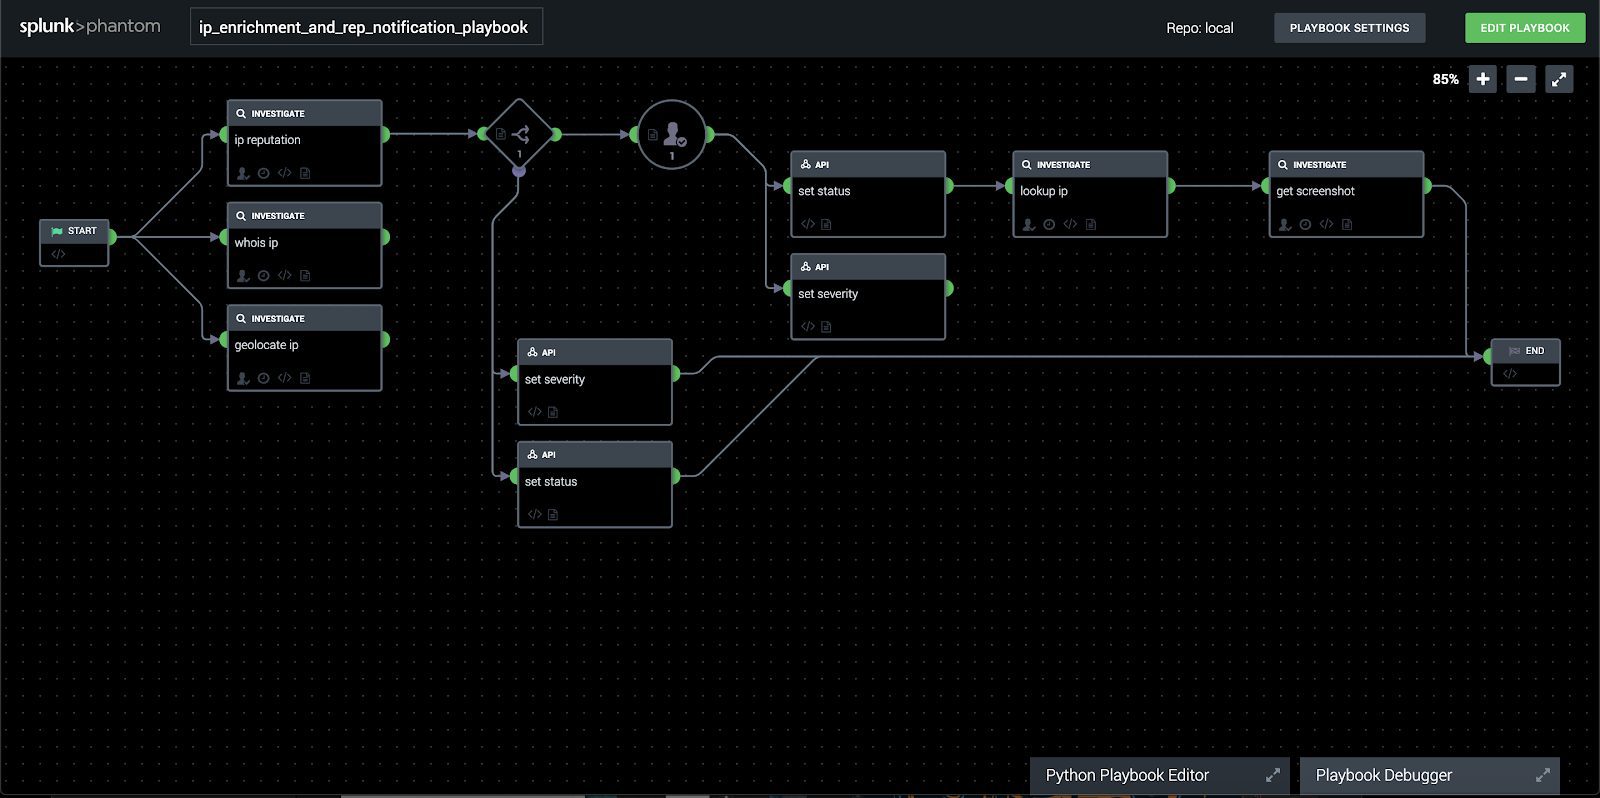
In our example here, we want to be able to enrich the source ip addresses of the detected DoS attacks, however lets add an additional set of notifying a user in Phantom whether or no the IP has tested positive as a known malicious source.
Using the graphic playbook editor, we can drop and drag the required elements into place, and configure them one by one as we place them, until eventually we have a somewhat basic, but relatively powerful playbook ready.

The last thing to do is configure our playbook to run automatically when events of this type arrive and investigate the results.
We do this by clicking Edit Playbook and selecting which containers we would like the playbook to run against, as well as making the Playbook live…

Now that we have the basics of Phantom, Playbooks and Splunk integration down, the possibilities have opened before us to automate enrichment and management of security tasks.
Get in Touch
Contact Shaq or the rest of our pre-sales team through our contact form.


