Overall Best Practice Data Onboarding Process

Author: Laurence Everitt
Release Date: 16/11/2022
Splunk can onboard all data, so why do
we need to discuss this?
Employing good data onboarding practices is essential to seeing a Splunk system work well. Wait, make that, “essential to seeing a Splunk system work”, period. Importantly, if a datasource is ingested with default configurations (i.e. throw the data at Splunk and get it to work it out), then Splunk will spend a lot of time and processing power guessing the right settings for each event AND THEN ingest the data. And by the way, it is possible to save yourself MONEY with this document if you are using the new Workload Processing License Model.

This is akin to me giving you individual sentences of several books in different languages to read, without providing the name of the book, language, the subject or even the symbol type to help you understand. As a good linguist, you may be able to make sense of the sentences and decipher the words, but it will take you time. If, instead, you are given the character set, the language, the subject and the name of the book, any adult can read it.
By setting up your sourcetypes correctly, you are changing Splunk from an experienced linguist who spends all of their time interpreting data (without understanding it) into any adult who is reading a book and getting value out of it!
Splunk wants to provide an easy onboarding experience and so they configure Splunk Enterprise accordingly. Sadly, those settings can also be the undoing of a Splunk server when sent lots of data and so the configuration needs to be optimised. The following are some best practices for data onboarding.
Overall Picture
If you don’t know the overall picture, here is a good overview of the process for configuring event processing. When setting up a new data sourcetype, there are 8 main configurations that need to be set up in ALL cases, however, there may be other configurations that may need to be completed to fully configure the sourcetype. In this article, I will mostly talk about “Splunk’s Great Eight”, as these save Splunk the most work when parsing events and sending data to indexers, but I will also include another 2 Optional Extras. The importance of these are as follows:
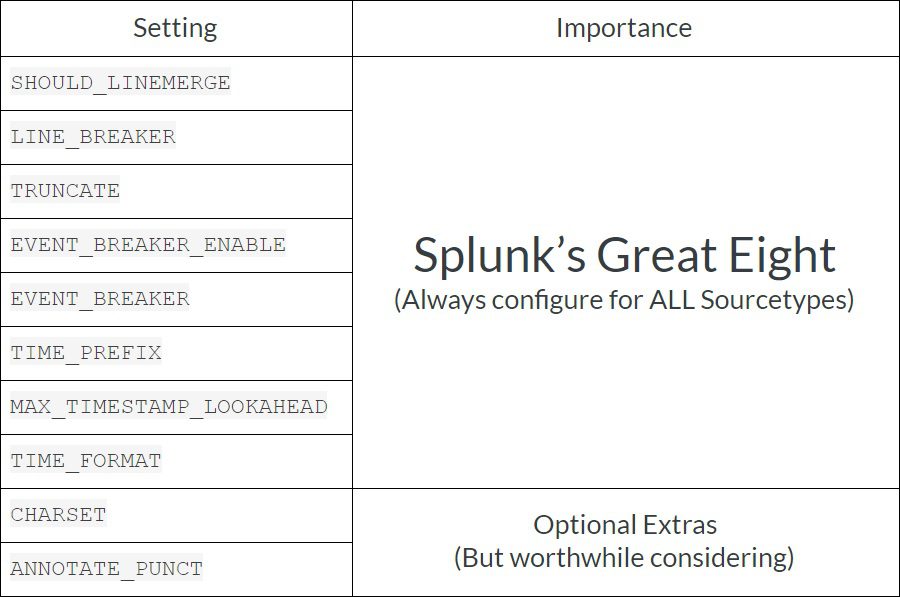
I can’t say this enough, if you don’t feel up to doing EVERYTHING in this document for all of your data sources and are thinking about picking and choosing which of these to do, ALWAYS configure Splunk’s Great Eight!
Worked Example Data Source
In this article, we are going to work through the data from an example event data set:
50 Event Date: 2020-07-21 02:04:54.214 fshdc.dom.com iis http://www.google.com/query=fishy
20 Event Date: 2020-07-21 02:05:58.004 fshdc.dom.com iis https://www.outlook.com/login
ERROR 404 Request aborted
90 Event Date: 2020-07-21 03:25:01.023 fshdc.dom.com iis http:/iplayer.bbc.com
Event Line Breaking
One of the first things that Splunk needs to know about a sourcetype is where it starts and stops. This is called event line breaking. If the data is ALWAYS on a single line, then this is simple – just wait for a New Line and/or Carriage Return combination – but sometimes (in the case of error events, the contents of the code stack can be included) second and subsequent lines will invariably be used. In this case, looking for the end of a line will not cut it and we need to find the beginning of the next event.
The configurations that we must set, in all cases: LINE_BREAKER, TRUNCATE and SHOULD_LINEMERGE.
LINE_BREAKER
This is a REGEX expression that sets the pattern that Splunk will look for to place a linebreaker. Splunk, by default, will look for any number of Carriage Returns and Line Feed characters as the line breakers, which is configured as ([\r\n]+). If each event is just one line, then this is adequate. However, Splunk Best Practice is to also check for the start of each event and then add that into the configuration in case the file has extra lines added when the software is upgraded/changed.
For the Worked Example, in order to stop the second event from being chopped up too soon, we should include the following setting setting, that will check for whether the timestamp is after a new line, two numbers and the words “Event Date: “ so the previous event is longer than one line:
LINE_BREAKER = ([\n\r]+)\d{2}\sEvent Date:\s\d{4}\-\d{2}\-\d{2}\s\d{2}\:\d{2}\:\d{2}\.\d{3}
By the way, Splunk requires that the items in the parentheses (REGEX capture group) are the line breaker. In the example above, these are any number of new lines (\n) and/or carriage returns (\r). Personally, I like to use regex101 to check my work – this can be picky to do!
TRUNCATE
This setting is, by default, set as 10,000 characters. This value is a reasonable setting, but for most sourcetypes, it needs to be tailored. I have seen a number of data sources where TRUNCATE was left at the default and events were truncated and the information was lost (For example, a JSON event could be curtailed and Splunk might not show the event in its nice JSON formatting). So, Splunk’s best practice dictates that this value should be set to a higher number than this; we always recommend that you get to know your data by uploading some representative data (say, 2 days’ worth?) to a “test” index and then look at the highest event length. Once you have this number, increase the value to provide a margin of about 10%.
A useful search that you can use to find the recommended TRUNCATE value is as follows:
index=”test” sourcetype=”<Your new Sourcetype name>”
| eval event_size=len(_raw)
| stats max(event_size) as max_event_size
| eval “Recommended TRUNCATE Value”=(max_event_size * 1.10)
| fields – event_size
An alternative approach (if you do not have time to perform this preparation) is to set TRUNCATE to 999999, which allows for Splunk to allow unusually large events, but stops Splunk from crashing because it has ingested a nonsensical file such as a picture or database file that came from a malicious user.
The Peril of Zero
It is POSSIBLE to set TRUNCATE to zero, whereby Splunk will never truncate an event, but that is not recommended, as, if there is a log file corruption and the line breaker is lost that many times, then Splunk can crash while waiting for an event to end (and that is never a good thing)!
For our worked example, as the maximum size that we have is 119 characters, we will set this to be 119 + 10%, as below:
TRUNCATE = 131
(By the way, I do see the irony in REDUCING the TRUNCATE setting for the worked example, but I REALLY did not want to fill your screen with events larger than 10,000 characters in order to prove a point.)
SHOULD_LINEMERGE
Splunk, by default, sets this value to true, in case a new sourcetype is multi-lined, however, leaving this setting as true is not considered Splunk Best Practice. When SHOULD_LINEMERGE is set to true, then this sets the Line Merge process running in the Aggregator Pipeline which will look at the events and will append all of the lines together (which, if the file is large, can be a costly process) before then splitting them out again in the next process. As we should have already used the LINE_BREAKER setting according to Splunk Best Practice, in the Worked Example we use:
SHOULD_LINEMERGE = false
In most cases, we should set SHOULD_LINEMERGE to false, but there can be some niche cases where it should be set to true, such as when there are more variable event types that a simple LINE_BREAKER will not cater for. If this configuration is set to true, then there are a few extra settings that can be used as well.
EVENT_BREAKER_ENABLE and EVENT_BREAKER
These two configurations are relatively new ones and they apply just to Universal Forwarders (UFs) version 6.5 and above. A UF will use this pair of configurations to ascertain when it is safe to swap between indexers in a cluster, to ensure that only whole events are sent. Previously, a UF would either only send to one indexer or another until it could not anymore or, if autoLB was set in the outputs.conf, then the events could be split incorrectly in the case of large events.
In most cases, EVENT_BREAKER_ENABLE needs to be set to true and the EVENT_BREAKER should match the value in LINE_BREAKER. This allows the Forwarder to send its events individually to all of the indexers in the cluster evenly.
So in our Worked Example, above (and the data is being read by a Splunk 7.3 Universal forwarder) we would provide the following configurations:
EVENT_BREAKER_ENABLE = true
EVENT_BREAKER = ([\n\r]+)\d{2}\sEvent Date:\s\d{4}\-\d{2}\-\d{2}\s\d{2}\:\d{2}\:\d{2}\.\d{3}
Further information can be found here about Event Line Breaking.
Event Timestamps
The other great performance boost that we can apply to Splunk data onboarding is telling Splunk about how the timestamps are to be found.
Splunk is pretty clever about finding time stamps for its events (because, well, without a timestamp, Splunk cannot organise the data) and so, when it has separated the data into events, it searches each event to find a timestamp. Several things of note about this generic process are that:
– Splunk looks at the first 128 characters in an event for the timestamp.
– Splunk uses the first timestamp that it finds in the event.
– Splunk uses over 30 different REGEX patterns to search the event for a suitable timestamp that it can use.
There are a few issues with this behaviour:
– The timestamp might not be in the first 128 characters of the event.
– The first timestamp that is in the data may not be the one that is needed.
– The date may be in a different format than Splunk thinks that it is (such as the Month/Day being switched), although there are some clever checks it does before validating this.
– Running over 30 different REGEX pattern searches FOR EACH EVENT is a LOT of work!
– The time zone may be wrong (and therefore the event time may be recorded incorrectly).
– Incorrect timestamps can result in data being aged out prematurely or retained for too long.
– Wrong timestamps can also cause Splunk to create unduly-small index buckets, making searches inefficient.
– All of this extra work can clog up a Heavy Forwarder or Indexer in the Aggregator Pipeline (and cost more on a Workload Processing License Model).
So the case for configuring our timestamps is pretty strong. We can reduce the amount of work that Splunk needs to do drastically and therefore give it more time for other tasks, such as searching, reporting, alerting and dashboarding by applying the Splunk Best Practices below.
TIME_PREFIX
This configuration is really useful for Splunk for several reasons, not least of all that it points to WHERE in the event it will find its most important piece of data – the timestamp – and it could be further than 128 characters into the event. Rather than making Splunk look into the first 128 characters for the right pattern of numbers and letters, we are saying, “no – look HERE”.
TIME_PREFIX is a REGEX and has no default value, but should be set to the unique part of the raw event that EXACTLY precedes the time. For example, taking the event snippet above, the time prefix would contain a part of the LINE_BREAKER, so we use this setting:
TIME_PREFIX = Event\sDate:\s
MAX_TIMESTAMP_LOOKAHEAD
This is a configuration that Splunk uses to work out how far from the beginning of the event (or, if we have set the TIME_PREFIX, from the end of that) to look for the timestamp. The default value is 128 characters, however, this should ALWAYS be changed to exactly reflect the length of the timestamp (because we set the TIME_PREFIX, didn’t we?) Splunk needs to look for it. We do not want to give Splunk any wiggle room to find the wrong timestamp and if it only has those characters to look at, well, it can only use those characters! Taking the Worked Example above, we should set:
MAX_TIMESTAMP_LOOKAHEAD = 23
NOTE: Some events can have variable-length timestamps, for instance “3 August 2020 1:12:9.001” – in this case, make sure that this setting is given the largest length possible, which would be 30.
TIME_FORMAT
This configuration is probably the best one for speed improvement. It has no default, and, without it, Splunk will go through that >30 timestamp checks process. Specifying the TIME_FORMAT reduces the chance of Splunk getting the wrong date. TIME_FORMAT uses the strptime syntax. If you do not know strptime, have a look here for the syntax. With this command, you are pointing to the items in the area that the timestamp that TIME_PREFIX and MAX_TIMESTAMP_LOOKAHEAD outline and saying what they actually represent.
In the example above, we would set the value:
TIME_FORMAT = %Y-%m-%d %H:%M:%S.%3N
NOTE: strptime is CASE SENSITIVE (for instance %Y indicates a 4-digit year, but %y is a 2-digit year).
Character Sets
The CHARSET field tells Splunk what type of character set the file is written in. Splunk, by default, uses UTF-8 decoding, but this can be incorrect and introduce errors in the interpretation if the document is in a different format, such as UTF-7 or CP874. The full documentation is here.
In our example, the data is in UTF-7 format, so we set:
CHARSET = UTF-7
The Punct Field
There is another optimization that Splunk taught me about the “punct” field. The addition of the punct field to a sourcetype is a default configuration within Splunk and it is sometimes useful for highlighting events with outlying patterns within searches (and therefore useful for seeing unusual/dangerous/illegal activity) however, it is rarely used and can be generated at search time in searches that may need it.
As generating the punct field is an extra piece of processing that Splunk will not need to do and as the field is added to the index of your data which you may never need, if you switch it off, then you will reduce:
– Indexing load on your Indexers and
– The amount of space each event takes up
Of course, depending on your system and number of sourcetypes, and indexes and sizes of events, your mileage in performance and data ingestion reductions will vary. However, this is something that Splunk allows for and it should be considered as an optimization.
To switch off the punct field, add the following to the sourcetype stanza in the props.conf:
ANNOTATE_PUNCT = false
At search time, if you find that the punct field is not there and you need it, you can use the eval command’s replace function in your search to add punct into your results. However, remember that, as the computation may be run upon a large number of events, then this will require a lot of extra power and be slow:
| eval punct = replace(replace(_raw, “\s”, “_”), “\w”, “”)
Saving Your Sourcetype
Name it Properly
When you create a regular document, you need to save it and give it a sensible name. It is the same in Splunk with your sourcetypes. In this case, the file is the props.conf and once you start to create your own sourcetypes, you will want to make sure that you are giving them sensible names, with a sensible naming convention. Splunk provide recommendations for the Splunk Administrator and they follow the overall format:
vendor:product:technology:format
Generally, this is a good method for naming the sourcetypes and should be followed. When looking at the worked example above, the product that generated it was a custom in-house item from Rhododendron Games, running in IIS, so the name (and completed definition) in the props.conf could be:
[rg:gamesale:iis:webtype]
LINE_BREAKER = ([\n\r]+)\d{2}\sEvent Date:\s\d{4}\-\d{2}\-\d{2}\s\d{2}\:\d{2}\:\d{2}\.\d{3}
TRUNCATE = 131
SHOULD_LINEMERGE = false
TIME_PREFIX = Event Date:\s
MAX_TIMESTAMP_LOOKAHEAD = 23
TIME_FORMAT = %Y-%m-%d %H:%M:%S.%3N
CHARSET = UTF-7
ANNOTATE_PUNCT = false
EVENT_BREAKER_ENABLE = true
EVENT_BREAKER = ([\n\r]+)\d{2}\sEvent Date:\s\d{4}\-\d{2}\-\d{2}\s\d{2}\:\d{2}\:\d{2}\.\d{3}
Where do we put our Definition?
Next, on what server do we place the props.conf? In the case of a single All-in-One Splunk server, this easy – you just put it there and on the Forwarders. However, in the case of a distributed Splunk environment, this is a bit trickier. The short answer is that we place it on the following Splunk servers:
– Search Heads
– Indexers
– Heavy Forwarders (where accompanied by the inputs.conf OR on an intermediate Heavy Forwarder, where it is the first full Splunk installation in the data path)
– Universal Forwarders (where accompanied by the inputs.conf)
The long answer is that the configurations in the props CAN be split out and only the elements that are relevant to the Universal Forwarders are placed on those servers and the parts that are needed on the Search Heads, HFs and Indexers are put on those servers. However, as each Splunk installation is clever enough to only use the elements that it needs, it is not worth using different configurations for each server. This approach simplifies the administration of Splunk.
Regardless, it is worth knowing where every configuration is used, so that if anything goes wrong on one server, you know where to change it!
Use an App, NOT system\local!
Yes, I know – even Splunk teaches you to write your configurations into the etc\system\local at certain levels in the training and in the documentation, however, we always recommend that you add your props.conf into an app that is then deployed to your infrastructure via Deployment Server, Cluster Master and/or Search Head Deployer. However, creating apps should be the subject of another blog post.
Sources
- FN1716 - Splunk Performance and Observations
- FN116776 - Observations and Recommendations on Splunk Performance
- SF77772 - Splunk Performance Reloaded - Best Practices for a Performant Splunk Deployment
- FN117015 - Data Onboarding: Where Do I Begin?
- https://community.splunk.com/t5/Getting-Data-In/What-are-the-best-practices-for-defining-source-types/m-p/423053#M74286