Splunk AppDynamics
What is Splunk AppDynamics?
Whether you’re managing legacy systems, cloud-native apps, or hybrid environments, Splunk AppDynamics helps you:
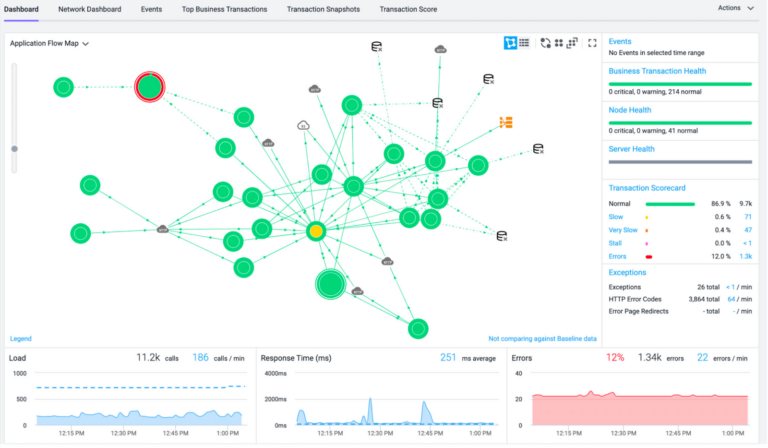
Monitor Applications in Real Time Across Every Layer of the Stack
Detect Anomalies and Performance Bottlenecks Before Users are Affected
Drill Down to Code-Level Diagnostics and Root Causes in Seconds
Connect Application Health to Key Business Metrics Like Revenue, Conversions, or SLAs
As part of the broader Splunk ecosystem, AppDynamics now integrates more closely with infrastructure monitoring, log analytics, and security tools – giving you a unified observability strategy from backend to customer experience.
AppDynamics at a Glance
Business iQ | ||||
|---|---|---|---|---|
Brings business and application insights together, giving real time context from customer to code.
| ||||
Business Transaction Monitoring | ||||
|---|---|---|---|---|
Monitor applications across AWS, Azure, on-prem and Kubernetes environments. | ||||
Synthetic & Real User Monitoring | ||||
|---|---|---|---|---|
Understand real-world user behaviour and simulate journeys across regions.
| ||||
Cloud & Hybrid Visibility | ||||
|---|---|---|---|---|
Monitor applications across AWS, Azure, on-prem and Kubernetes environments.
| ||||
Smart Alerts & Anomaly Detection | ||||
|---|---|---|---|---|
Use AI/ML to detect unusual behaviour – and avoid alert fatigue.
| ||||
Built-in Security Context | ||||
|---|---|---|---|---|
Monitor runtime behaviour and spot potential security risks early.
| ||||
Expert APM Deployment
Splunk Ecosystem Integration
Industry-Specific Experience
Ongoing Support & Enablement
Application Support & DevOps Teams
Business & Product Owners
Security-Aware Environments
Public Sector Applications
Feature/Capability | Splunk AppDynamics | Other APM Platforms |
|---|---|---|
Business Transaction Mapping
| Native, real-time mapping of user journeys to business KPIs | Limited or manual setup required |
Code-Level Diagnostics
| Deep diagnostics down to class/method level
| Varies – often surface-level visibility
|
AI Powered Anomlay Detection
| Built in AI/ML with contextual anomaly insights
| May require additional configuration or third-party tools
|
User Experience Monitoring
| Integrated RUM & synthetic monitoring
| Typically separate or add-on modules
|
Cloud & Hybrid Support
| Designed for hybrid, cloud-native and legacy environments
| Focused on either cloud-native or on-prem, not both
|
Integration with Observability & Security
| Seamless correlation with Splunk, Cisco Secure App, and more
| Limited cross-tool interoperability
|
Real-Time Visibility
| Live data streaming with no sampling
| Often based on sampled or delayed data
|
Business Impact Visibility
| Alerts tied to revenue, conversion or SLA impact
| Usually forced only on technical metrics
|
Enterprise & Public Sector Readiness
| Proven across financial services, government, defence
| Varies – not always designed for secure deployments
|
Your AppDynamics Journey with Somerford
Discovery & Architecture
Understand your application stack, business goals, and performance challenges.
Integration with Splunk
Correlate AppDynamics APM data with logs, infrastructure metrics, and alerts.
Ongoing Support & Optimisation
As your environment grows, we evolve your observability with it.
Deployment & Configuration
Instrument applications, tune alerts, define business transactions and dashboards.
Enablement & Handover
Train teams, establish SOPs, and ensure confidence in platform usage.
Splunk AppDynamics Video Series
This video series provides a practical, demo-led overview of Splunk AppDynamics observability, showing how organisations can gain full visibility across both application performance and underlying infrastructure.