Video Summary
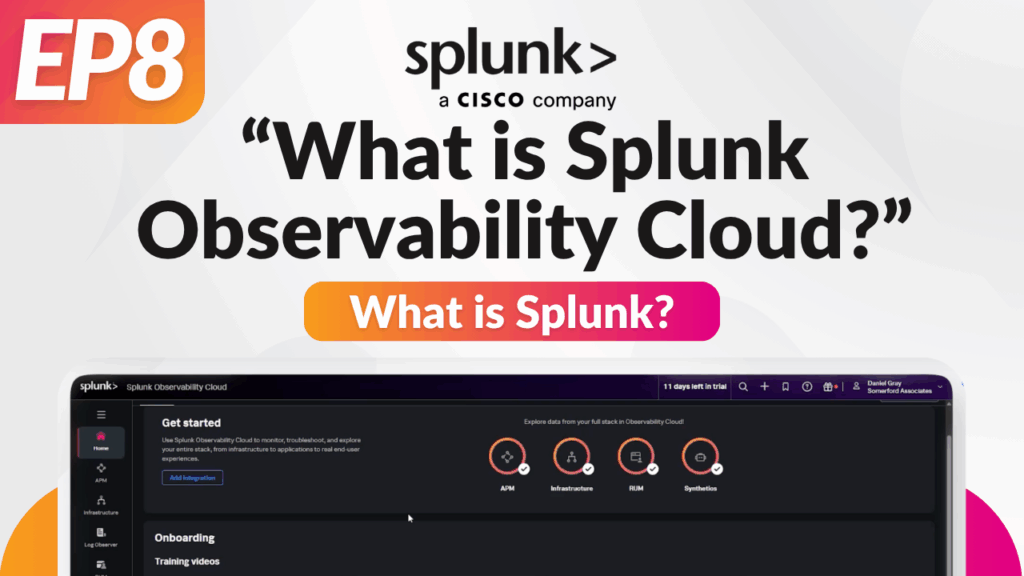
Introducing Splunk Observability Cloud
Splunk Observability Cloud provides full-stack monitoring across infrastructure, applications, and user experience. The platform is designed to reduce both mean time to detect (MTTD) and mean time to resolve (MTTR) issues across modern environments. Crucially, users remain in control of their data ingestion, allowing for better cost management.Real User Monitoring (RUM)
Tracking Actual User Behaviour
RUM helps monitor how real users interact with web applications. The platform captures metrics like Largest Contentful Paint, First Input Delay, and JavaScript errors, providing insight into frontend performance and user frustration points.Tag Spotlight and Filtering
Tag Spotlight enables users to drill into session data using key-value tags such as browser type, operating system, or location. For example, user activity in Wolverhampton can be isolated to identify specific delays.User Session Replay
Replay features allow teams to visually analyse user journeys, including click paths and timing issues. Data is anonymised by default, with customisation options based on privacy needs.Application Performance Monitoring (APM)
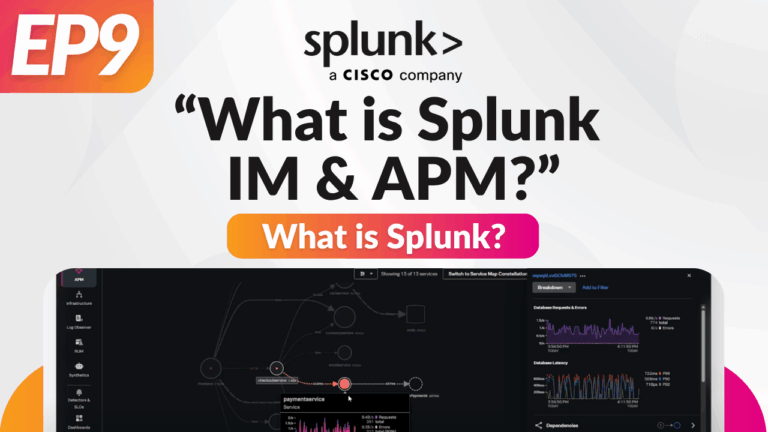
Service Maps and Traces
APM shows application performance through service maps and waterfall traces. When accessed via RUM, filters are auto-applied, allowing precise investigation of errors without starting from scratch.Root Cause Analysis
Detectors highlight problematic spans and allow immediate navigation into application components or connected infrastructure. Related content links keep context consistent across tools.Log Observer
Connected Log Insights Without SPL
Log Observer pulls logs directly from Splunk Enterprise without re-ingesting data. Users can filter and group logs via a GUI, eliminating the need for SPL. For instance, filtering for severity = error revealed an invalid API token left in production code.Version Comparisons
Grouping logs by version showed that only v35.0.10 generated errors, while v35.0.9 operated as expected - making it easy to identify regressions and plan rollbacks.Synthetic Monitoring
Proactive Testing
Synthetics simulate user workflows from global AWS regions. Tests can include browser sessions, API health, port checks, and page loads. Metrics such as time to first byte highlight latency issues in real time.Automated Test Journeys
Synthetic sessions play back browser journeys, helping detect failed states like checkout timeouts. Combined with filmstrips and waterfall views, they offer a proactive defence against downtime.Final Thoughts
End-to-End Observability
Splunk Observability Cloud delivers comprehensive monitoring from infrastructure to real and synthetic user experiences. With features like related content, integrated logs, and no-code diagnostics, teams can identify and resolve issues faster.Other Videos in this Series

What is Splunk Enterprise & Cloud?
Episode 1

What is Cisco XDR?
Episode 7
Additional Resources
Who are Somerford?
We are a passionate group of people delivering innovation to our customers on their digital transformation journey.
Splunk Observability Suite
Utilise Splunk's suite of observability to unleash real-time insights.
Splunk O11y Cloud Video Series
Watch our video series where we delve deeper into Splunk O11y Cloud.
Get in Touch to Learn More
At Somerford, we are proud to be an Elite Splunk partner with specialist certified consultants in different areas of the Splunk suite. If you'd like to speak with one of our video presenters, or connect with one of our other experts, please get in touch with us today.


