Video
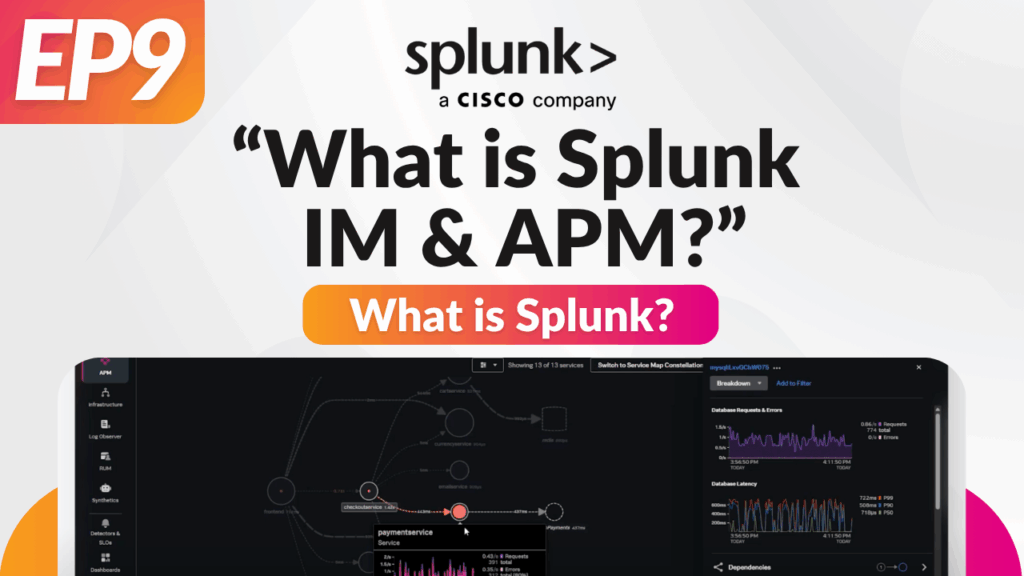
Click the image to sign up to receive access to our video guide explaining 'What is Splunk Infrastructure Monitoring and APM?'.
Video Summary
Diving Deeper into Splunk APM
Service Level Awareness
Splunk APM allows services to be analysed by tenant level (e.g., Gold, Silver, Bronze customers). This helps teams monitor whether performance or errors are disproportionately affecting key customer tiers. In this case, error rates were evenly distributed, but the feature is crucial for meeting SLAs.Version-Level Breakdown
The ability to filter by application version revealed that version 350.10 had a 100% error rate, while 350.9 had none. This empowers teams to track performance by release version and detect issues in real time as new versions are rolled out.
Tag Spotlight for Advanced Troubleshooting
Tag-Based Analysis
Each transaction is tagged with metadata (e.g., version, workflow, tenant). Tag Spotlight helps surface patterns in error rates by breaking down data by these tags. This accelerates root cause analysis and supports targeted remediation.Logs Reveal Root Cause
By pivoting into logs from the APM interface, the root cause of the error was identified as an invalid API token in the faulty version. The related content feature ensured a seamless transition from service-level metrics to container-level logs.
Drilling into Infrastructure and Kubernetes
Contextual Navigation
From APM, users can directly access infrastructure metrics associated with a problematic service. This includes container-level stats like CPU, memory, and network usage.Kubernetes Navigator
Observability Cloud features a powerful out-of-the-box Kubernetes Navigator. It presents performance data in intuitive dashboards and heatmaps, helping users detect issues such as:• High container restart rates
• Elevated CPU utilisation
• Pod-level memory spikes
Heatmap Views
Metrics such as restarts or CPU usage colour the heatmap to visualise performance hot spots. Users can drill into any container or pod for detailed stats and diagnostics.Beyond Kubernetes
Traditional Infrastructure Monitoring
Support extends beyond containers to traditional Linux-based infrastructure. Hosts display the same type of detailed dashboards and performance metrics.Dashboards and Detectors
• Pre-built dashboards cover Kubernetes, APM, Java services, and data centre hosts• Custom dashboards can be created to suit specific operational needs
• Built-in detectors alert on conditions like CPU saturation or service degradation
• Custom detectors can also be configured for bespoke monitoring needs
Observability Benefits
Key benefits include:• Real-time, unsampled APM insights
• Kubernetes-native infrastructure monitoring
• Tag-driven troubleshooting and version tracking
• Seamless pivoting from metrics to logs and infrastructure
• Out-of-the-box dashboards and alerts
Other Videos in this Series
What is Splunk Enterprise & Cloud?
Episode 1
What is Splunk Observability Cloud?
Episode 8
What is Cisco ThousandEyes?
Episode 10
Additional Resources
Who are Somerford?
We are a passionate group of people delivering innovation to our customers on their digital transformation journey.
Splunk Observability Suite
Utilise Splunk's suite of observability to unleash real-time insights.
Splunk O11y Cloud - Infrastructure Monitoring
Watch our video where we go further in depth about Splunk Infrastructure Monitoring.
Get in Touch to Learn More
At Somerford, we are proud to be an Elite Splunk partner with specialist certified consultants in different areas of the Splunk suite. If you'd like to speak with one of our video presenters, or connect with one of our other experts, please get in touch with us today.