Video Summary
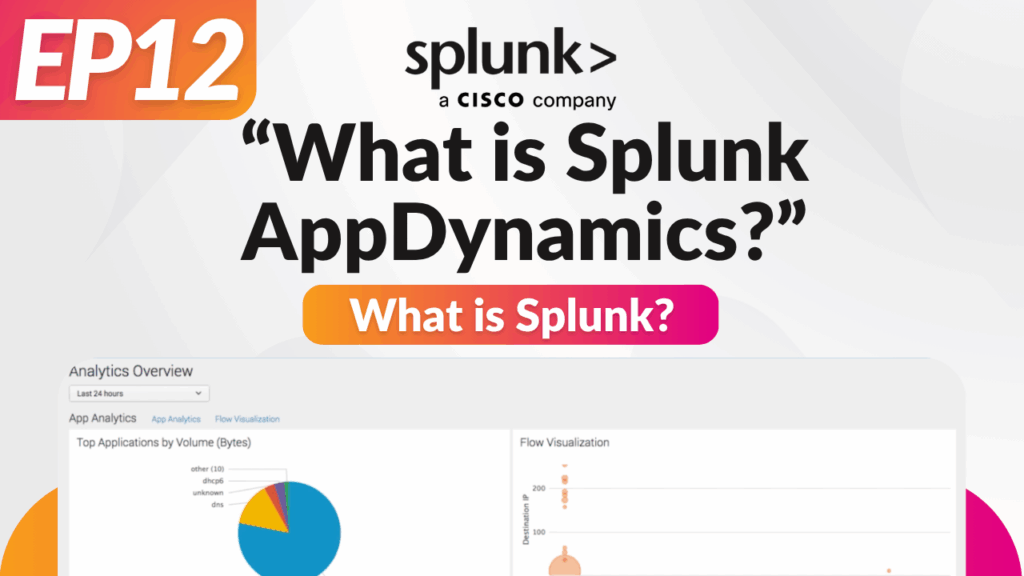
Splunk AppDynamics is the next generation of full-stack observability, integrating powerful application performance monitoring capabilities with the wider Cisco and Splunk observability ecosystem. Following the rebrand from AppDynamics to Splunk AppDynamics, the platform now provides greater visibility across on-premises, cloud, and hybrid environments.
This unified solution transforms application, server, network and device data into actionable insights. It enables organisations to detect patterns, monitor key metrics, troubleshoot issues and drive intelligent, data-led decisions to improve business performance.
Studies show that 80 percent of performance issues are identified by users before IT teams are even aware of them. In today’s digital-first world, observability is no longer just a concern for IT departments - it's critical to overall business success.
• Visualise application architecture and performance in real time
• Detect abnormalities or performance bottlenecks
• Take immediate action to optimise system performance and minimise downtime
Splunk AppDynamics supports proactive service protection, helping organisations deliver seamless, consistent user experiences aligned with business goals.
• Agents – Installed within applications (e.g. Java, .NET, Python), agents collect detailed performance data from on-premises, cloud or Kubernetes environments
• Controller– A centralised platform (hosted on-premises or SaaS) that receives and analyses data in real time
• Insights– Dashboards, alerts and reports generated from processed data provide visibility and proactive recommendations
It functions much like a diagnostic tool for digital systems, continuously monitoring transactions, identifying bottlenecks and delivering alerts before users are impacted.
• Applications and transactions
• Servers and infrastructure
• End-user devices (browser and mobile)
• Synthetic transactions and test environments
• AI-driven anomaly detection
• Improve customer satisfaction by delivering fast, reliable application performance
• Reduce downtime through proactive issue detection and alerting
• Make smarter, data-led decisions tied to KPIs like revenue, conversion and retention
• Resolve issues faster using AI-powered diagnostics
• Enhance operational efficiency while managing costs and boosting revenue growth
• Splunk Observability Cloud
• Splunk Platform
• Splunk IT Service Intelligence
Users can centralise log analytics, reduce alert noise, correlate service health with business KPIs and improve visibility across cloud-native environments. This unified experience supports faster detection, resolution and optimisation of business-critical systems.
• Navigation tabs for business transactions, endpoints, nodes, servers, databases and more
• Top navigation for analytics, snapshots and flow maps
• Performance charts for application load, response time and error rates
• Metrics panel displaying alerts and health rule statuses
• View detailed snapshots
• Filter transactions
• Drill down to pinpoint errors or bottlenecks
• Health status of agents
• Restart history
• Metrics for response time, memory and error rates
Machine agents provide visibility into:
• CPU and memory usage
• Disk utilisation
Database performance (response times, call volume)
• Email
• Slack
• ITSM tools like ServiceNow
• Automated remediation workflows
• Analyse and compare data across different time frames or components
• Create and download custom charts
• Share insights with leadership or incident management teams
This unified solution transforms application, server, network and device data into actionable insights. It enables organisations to detect patterns, monitor key metrics, troubleshoot issues and drive intelligent, data-led decisions to improve business performance.
The Importance of Observability
Digital Experience as a Business Priority
Consider a scenario where a customer is completing an online purchase or booking a holiday, only for the site to crash before payment is confirmed. From a user’s perspective, this is frustrating and erodes trust. For the business, it's a lost sale and a potential reputational hit. Negative experiences are often shared, leading to longer-term revenue loss.Studies show that 80 percent of performance issues are identified by users before IT teams are even aware of them. In today’s digital-first world, observability is no longer just a concern for IT departments - it's critical to overall business success.
Why Observability Matters
Observability turns raw data into meaningful insights by analysing logs, metrics and traces. It allows organisations to:• Visualise application architecture and performance in real time
• Detect abnormalities or performance bottlenecks
• Take immediate action to optimise system performance and minimise downtime
Splunk AppDynamics supports proactive service protection, helping organisations deliver seamless, consistent user experiences aligned with business goals.
How Splunk AppDynamics Works
Three Core Components
Splunk AppDynamics operates through three key components:• Agents – Installed within applications (e.g. Java, .NET, Python), agents collect detailed performance data from on-premises, cloud or Kubernetes environments
• Controller– A centralised platform (hosted on-premises or SaaS) that receives and analyses data in real time
• Insights– Dashboards, alerts and reports generated from processed data provide visibility and proactive recommendations
It functions much like a diagnostic tool for digital systems, continuously monitoring transactions, identifying bottlenecks and delivering alerts before users are impacted.
Seamless Integration
Splunk AppDynamics is designed for flexibility, supporting both cloud-native and hybrid deployments. It brings together performance data from diverse systems into a unified view, giving organisations the tools to manage increasingly complex IT environments.Key Benefits of Splunk AppDynamics
Splunk AppDynamics provides robust monitoring and performance analysis across:• Applications and transactions
• Servers and infrastructure
• End-user devices (browser and mobile)
• Synthetic transactions and test environments
• AI-driven anomaly detection
Outcomes for IT and Business Teams
With this level of visibility, organisations can:• Improve customer satisfaction by delivering fast, reliable application performance
• Reduce downtime through proactive issue detection and alerting
• Make smarter, data-led decisions tied to KPIs like revenue, conversion and retention
• Resolve issues faster using AI-powered diagnostics
• Enhance operational efficiency while managing costs and boosting revenue growth
Integration Across the Observability Stack
As part of the broader Splunk ecosystem, Splunk AppDynamics integrates with:• Splunk Observability Cloud
• Splunk Platform
• Splunk IT Service Intelligence
Users can centralise log analytics, reduce alert noise, correlate service health with business KPIs and improve visibility across cloud-native environments. This unified experience supports faster detection, resolution and optimisation of business-critical systems.
Exploring the Splunk AppDynamics Dashboard
Main Dashboard Interface
Upon logging into the controller, users are presented with an overview of the monitored application environment. The interface includes:• Navigation tabs for business transactions, endpoints, nodes, servers, databases and more
• Top navigation for analytics, snapshots and flow maps
• Performance charts for application load, response time and error rates
• Metrics panel displaying alerts and health rule statuses
Getting Started with Agent Installation
Once licensed, users gain access to the controller and login credentials. From the ‘Getting Started’ section, agents can be configured for various environments including Java, .NET and Python. After installing and restarting the application, the agents begin reporting data that appears on the dashboard automatically.Business Transactions and Deep Diagnostics
Monitoring Transactions
The Business Transactions tab reveals specific user actions like login or checkout. For each transaction, performance metrics such as calls per minute, errors and response time are displayed. Users can:• View detailed snapshots
• Filter transactions
• Drill down to pinpoint errors or bottlenecks
Root Cause Analysis
Snapshots offer visual flow maps, call stacks and slow transactions. For example, a poorly performing query can be identified and shared with database administrators to optimise performance and reduce latency.Tiers, Nodes and Infrastructure Monitoring
AppDynamics automatically identifies application tiers and associated nodes post-installation. Users can view:• Health status of agents
• Restart history
• Metrics for response time, memory and error rates
Machine agents provide visibility into:
• CPU and memory usage
• Disk utilisation
Database performance (response times, call volume)
Proactive Troubleshooting and Alerts
Real-Time Issue Detection
The Troubleshooting tab provides visibility into slow response times and errors. Teams can drill into problem areas to assess and resolve issues proactively.Health Rules and Alerting
Users can configure custom health rules based on specific business transactions or metrics. Alerts can be scheduled and tailored to business hours or other criteria. Alert policies can trigger notifications via:• Slack
• ITSM tools like ServiceNow
• Automated remediation workflows
Metric Browsers and Custom Charts
The metric browser allows teams to:• Analyse and compare data across different time frames or components
• Create and download custom charts
• Share insights with leadership or incident management teams
Conclusion
Splunk AppDynamics delivers end-to-end visibility across the modern IT estate. By combining deep diagnostics with real-time performance monitoring and proactive alerting, it helps organisations avoid downtime, enhance user experience and align IT services with business objectives. As part of the broader Splunk observability suite, it is a powerful solution for driving operational resilience and digital excellence.Other Videos in this Series

What is Splunk Enterprise & Cloud?
Episode 1

What is Splunk Edge Hub?
Episode 13
Additional Resources
Who are Somerford?
We are a passionate group of people delivering innovation to our customers on their digital transformation journey.
Splunk Observability Suite
Utilise Splunk's suite of observability to unleash real-time insights.
Splunk AppDynamics
Deliver faster, more reliable digital experiences - with real-time insights into code-level issues, user behaviour and business transactions.
Get in Touch to Learn More
At Somerford, we are proud to be an Elite Splunk partner with specialist certified consultants in different areas of the Splunk suite. If you'd like to speak with one of our video presenters, or connect with one of our other experts, please get in touch with us today.


