Why Choose Splunk Observability Cloud?
Author: Owais Ghaffar
Release Date: 28/08/2025
Understanding Observability: More Than Just Monitoring
Modern IT environments are sprawling, dynamic, and increasingly complex. From containerised microservices to hybrid cloud infrastructure, the sheer scale and fluidity of today’s systems present a unique challenge: ensuring performance, availability, and reliability without getting buried in alert fatigue and siloed data.
That’s where observability comes in. Observability isn’t just a new word for monitoring. It's about giving teams actionable insights across the entire stack—from frontend latency to backend system errors, from infrastructure performance to business metrics.
In practice, observability answers three core questions:
• What is happening? (real-time data collection across logs, metrics, and traces)
• Why is it happening? (contextual correlations across systems and services)
• What should we do about it? (fast root-cause analysis and intelligent alerting)
The Pain Points Observability Solves
Before organisations embrace observability, they typically battle:
• Tool sprawl: Logs here, metrics there, traces somewhere else.
• Lack of context: Alerts fire but lack the full picture of impact.
• Siloed teams: Developers, ops, and business analysts often operate on different tools and assumptions.
• High MTTR (Mean Time To Resolution): Without visibility into dependencies and context, issues take longer to resolve.
• Inability to scale: Legacy monitoring tools break under the weight of modern, ephemeral infrastructure.
Enter: Splunk Observability Cloud
Splunk’s Observability Cloud brings together the trifecta of metrics, traces, and logs into a single, high-performing, AI-driven platform. It’s designed for teams that need speed, scale, and clarity in their observability journey.
Let’s look at what makes it stand out:
1. Unified Telemetry in Real-Time
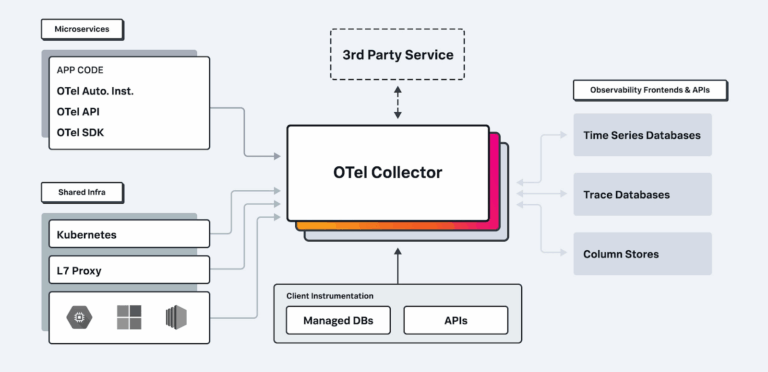
Splunk uses OpenTelemetry natively to collect telemetry from any source and stitches it together in milliseconds. This allows full-fidelity streaming data, not just sampled or delayed snapshots. Engineers get complete visibility without trade-offs.

2. No Sampled Traces – Full Context
Unlike competitors that sample traces and lose critical detail, Splunk captures 100% of trace data. This means when you need to debug that one intermittent issue, the trace is there. No guesswork.
3. AI-Driven Root Cause Analysis
Splunk leverages machine learning to automatically detect anomalies and surface probable causes across the stack. This significantly reduces MTTR and helps teams respond before customers notice.
4. Best-in-Class Dashboards and SLO Monitoring
Whether it’s infrastructure performance, application latency, or user journeys, dashboards in Splunk Observability Cloud are intuitive, fast, and customisable. You can define and monitor Service Level Objectives (SLOs) to align technical performance with business goals.

5. Seamless Integration with Splunk Enterprise
Already using Splunk Enterprise for log analytics or security? Observability Cloud plugs right in, meaning you can combine operational telemetry with business data, security logs, and more for truly unified insights.
Use Case: A Real-World Example
A large financial services provider noticed delayed fraud detection alerts during peak transaction hours. With millions of data points flowing through their infrastructure every minute, their legacy monitoring tools couldn’t surface insights fast enough.
By deploying Splunk Observability Cloud:
• The institution leveraged full-fidelity tracing and metrics to pinpoint a bottleneck in their fraud scoring API.
• OpenTelemetry auto-instrumentation captured real-time transaction paths, revealing excessive latency in a third-party scoring engine.
• Splunk’s AI-driven alerting flagged the degradation within minutes, allowing teams to reroute traffic and maintain compliance with internal SLAs.
The outcome? Fraud detection time dropped by 40%, customer experience improved, and operational risk was minimised during peak trading hours.
Conclusion: Why Splunk Observability Cloud?
Splunk Observability Cloud isn’t just another monitoring tool. It’s a powerful, unified platform purpose-built for cloud-native environments. With its ability to correlate logs, metrics, and traces in real-time and provide intelligent insights with minimal configuration—it empowers teams to deliver better customer experiences, improve system reliability and reduce alert noise. In a world where seconds matter, Splunk Observability Cloud helps you move fast and stay in control!

