What is Splunk APM?
Author: Daniel Gray
Release Date: 10/12/2025
Introducing Application Performance Monitoring
As modern systems scale across containers, Kubernetes, and multi-cloud environments, traditional monitoring often falls short. Sampling traces or siloing data means you lose the full picture of what’s happening inside your applications, this leads to blind spots in your monitoring and may lead to an incident becoming an outage.
Splunk Application Performance Monitoring (APM) solves this problem, it is a platform built to correlate metrics, traces, logs, and profiling in real time. It allows you complete visibility into your services and dependencies without blind spots.
Getting Data In
We start this process by getting data in. Splunk APM is powered by OpenTelemetry (OTel), the open standard for observability data. This means you don’t have to worry about vendor lock-in or custom agents.
You can take advantage of zero-code instrumentation, which is available for applications written in Java, Node.js, .NET, Go, Python, Ruby, and PHP. It automatically collects telemetry data for code written using supported libraries in each language.
For applications not written in these languages, you can take advantage of the OTel SDKs to add spans and tags programmatically.
By onboarding infrastructure metrics, you can integrate with Kubernetes, AWS, GCP, and Azure to tie application behaviour directly to infrastructure health.
Key Capabilities
Once your data is in, you can take advantage of the out-of-the-box monitoring dashboards, which display Rate, Error and Duration metrics.
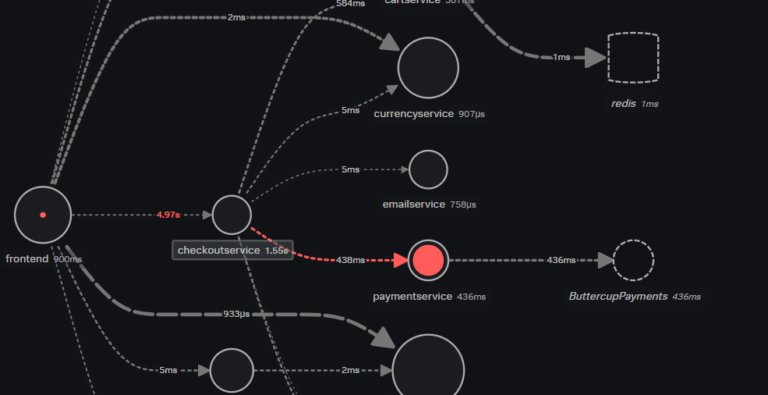
A live service map is automatically generated by Splunk APM. Each node represents a service, database, or external dependency. Map updates happen in real time as your deployment changes.

This enables you to reduce your mean time to resolution by knowing exactly where your application is breaking down and with linked infrastructure tags, which hosts are causing the degradation.
AI-Directed Troubleshooting
Instead of manually sifting through individual dashboards, isolate problems more efficiently. Automatically identify anomalies and the sources of errors that most significantly affect services and customers.
Distributed Tracing
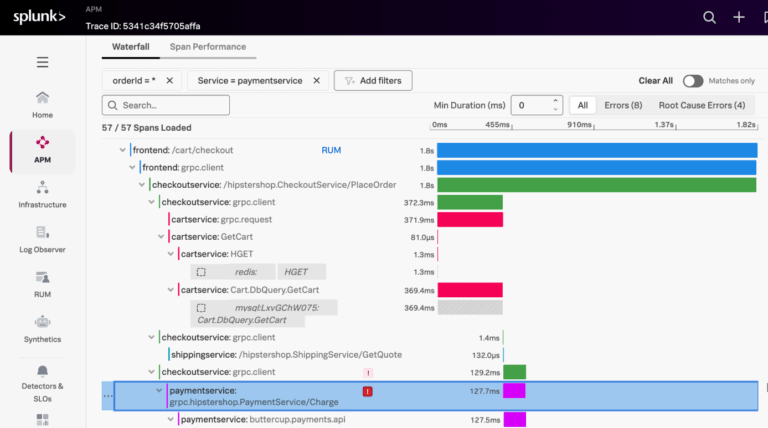
At the core of Splunk APM is NoSample distributed tracing: Splunk distributed tracing visualizes and correlates every transaction from the back-end and front-end in context with your infrastructure, business workflows and applications.

This context makes it obvious where in the checkout process the latency is coming from.
Final Thoughts
Splunk APM isn’t just another monitoring tool. It was designed for cloud native environments from the ground up. It gives you the visibility you need with no blind spots to enable you to detect problems instantly, understand the root cause through AI-directed troubleshooting.
With Splunk APM, you can reduce your mean time to detection, mean time to resolution and optimise your services by identifying troublesome areas. If you'd like to learn more about Splunk's Application Performance Monitoring solution, please join us for one of our upcoming events, or get in touch, and we can discuss this further!

