5 Issues Splunk Observability Cloud Solves

Author: Owais Ghaffar
Release Date: 15/10/2025

Organisations today run on complex digital infrastructure; distributed services, hybrid clouds, container orchestration, third-party APIs, and CI/CD pipelines that ship code faster than ever. With this complexity comes fragility: slowdowns, outages, and blind spots that can quickly turn into customer complaints, regulatory scrutiny, or reputational damage.

Traditional monitoring tools often can’t keep up. They offer snapshots, not stories. They inundate you with alerts but fail to inform you of what actually matters. And they separate logs, metrics, and traces instead of bringing them together.

Splunk Observability Cloud was built to change that.

Below, we explore five common pain points for modern IT and how Splunk Observability Cloud solves them—empowering medium to large organisations, especially in sectors like finance, insurance, and public services, to operate with clarity, speed, and confidence.

1. Blind Spots in Microservices and Kubernetes

The Problem: Microservices are dynamic. They spin up and down constantly. Kubernetes adds another abstraction layer.
Traditional tools struggle to track ephemeral containers and interdependent services.

How Splunk Helps:

• Uses auto-instrumentation and OpenTelemetry to capture telemetry from every container and pod.
• Real-time service maps show how services connect and where issues arise.
• You can trace a request from frontend to database—even if the container it touched no longer exists.

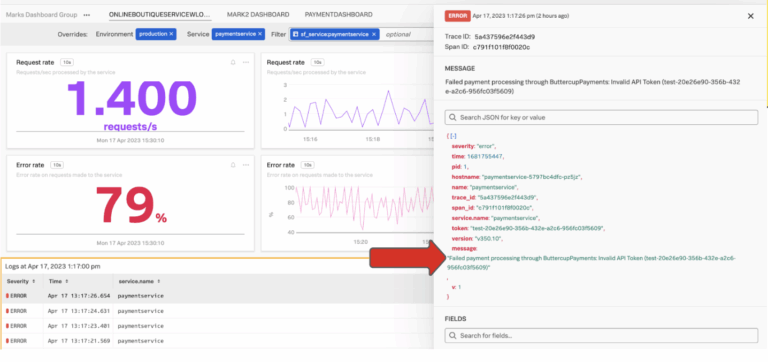
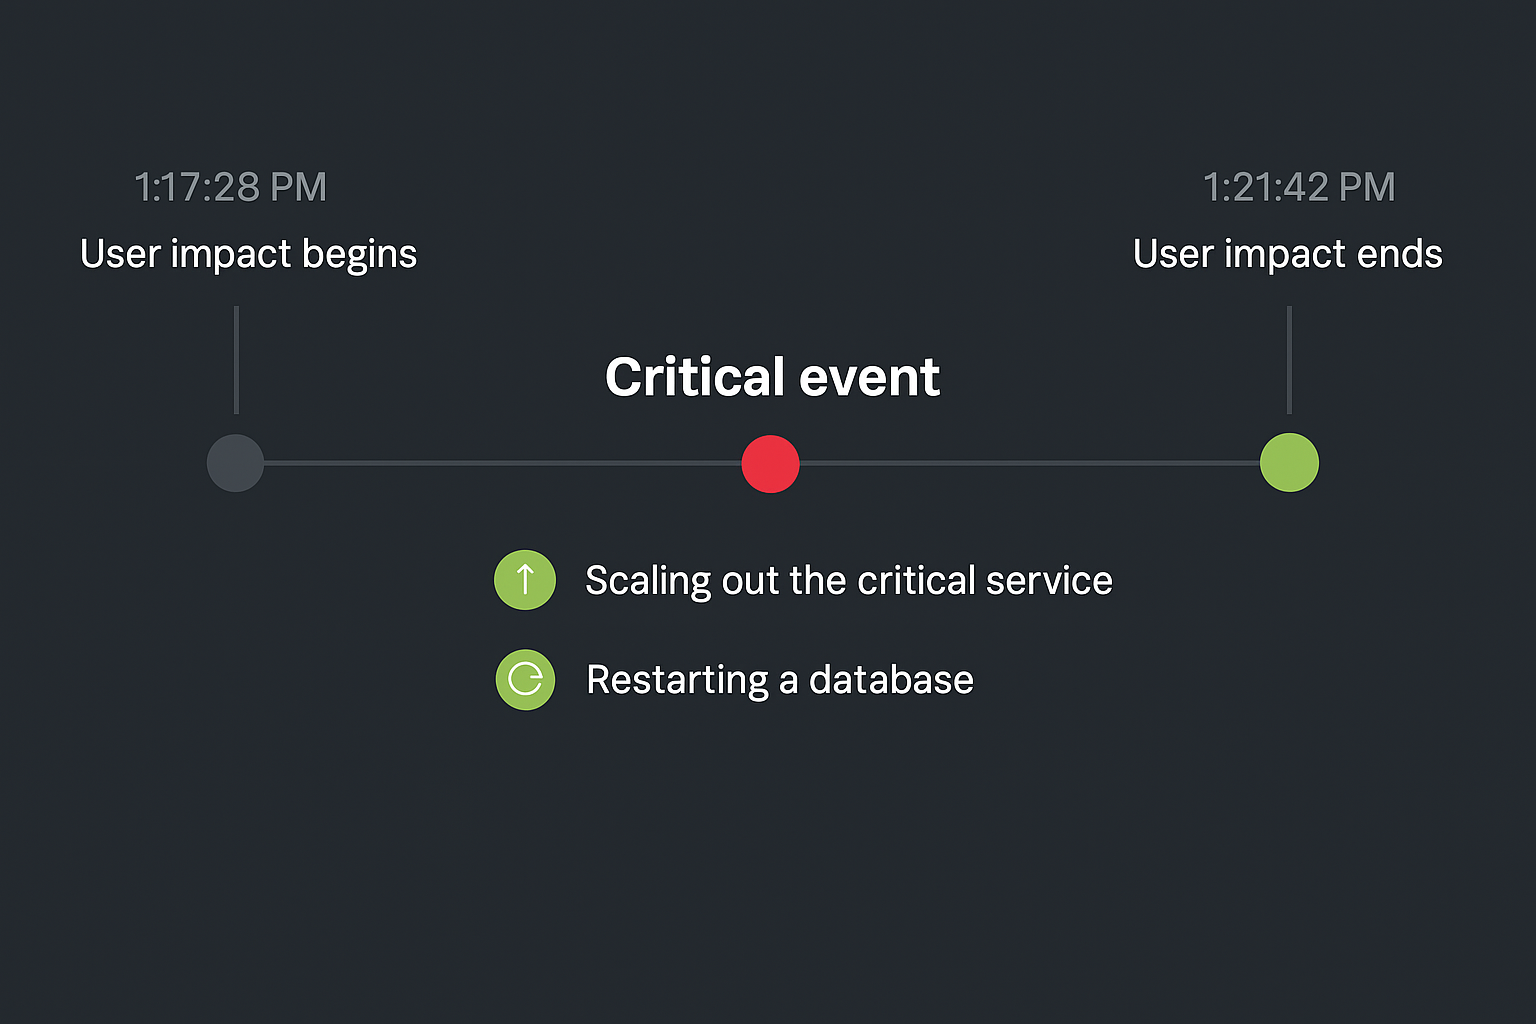
2. High MTTR (Mean Time To Resolution)

The Problem: When something breaks, multiple teams get involved—AppDev, Infra, SecOps. Hours are wasted piecing together logs, metrics, and alerts from different tools.

How Splunk Helps:

• Combines logs, metrics, and traces in one view, allowing teams to correlate issues instantly.
• AI-powered root cause analysis accelerates triage and resolution.
• Keeps 100% of trace data, so you never miss the intermittent issue.

3. Inability to Monitor SLAs and SLOs Effectively

The Problem: Businesses commit to performance standards (SLAs and SLOs), but most teams can’t see these metrics in real time or tie them to user experience.

How Splunk Helps:

• Lets you define and track custom SLOs, from service latency to error budgets.
• Alert when performance dips below thresholds that impact customers.
• Map technical metrics to business outcomes.

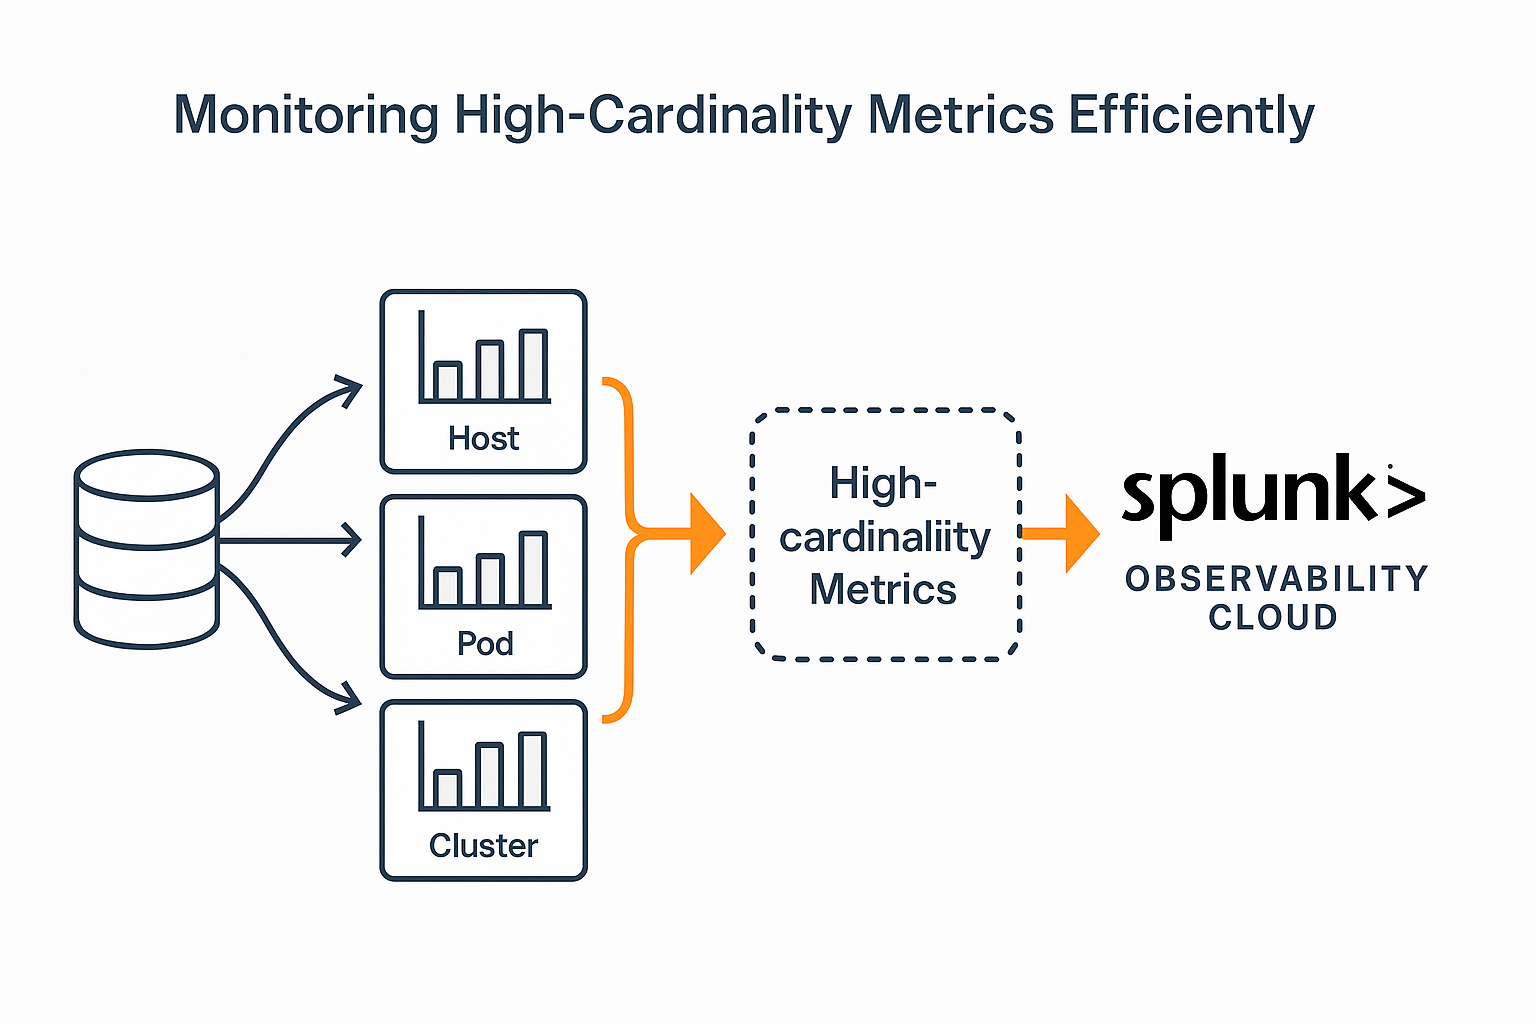
4. Scaling Observability Without Breaking the Budget

The Problem: Some observability tools charge based on cardinality (number of unique metric combinations), or by ingest volume—costs quickly balloon.

How Splunk Helps:

• Built for high-cardinality data—ideal for environments with many services, users, or dynamic infrastructure.
• Streaming architecture with real-time ingestion and compression keeps performance high and costs predictable.
• Full-fidelity data means no need to sample and risk missing issues.

5. Lack of End-to-End Visibility in Regulated Industries

The Problem: Organisations in finance, insurance, and government face strict compliance requirements. Auditing outages or latency spikes can be painful without traceability.

How Splunk Helps:

• Maintains a complete audit trail of application behaviour and telemetry.
• Helps teams answer: What failed? When? Who was affected?
• Combine observability data with security logs in Splunk Enterprise to support regulatory reporting.

Final Thoughts

Modern observability isn’t just about seeing everything—it’s about understanding everything in context. Splunk Observability Cloud helps medium to large organisations tame complexity, reduce downtime, and align technical performance with business success.

It goes beyond observability—it empowers your teams to act faster and smarter.

More Resources like this one:

What is Splunk? Enterprise & Cloud Overview (2025)

Splunk Observability Cloud 101 — Beginner's Guide

Interested in O11Y Cloud?

For more information on Splunk Observability Cloud, please get in touch!
Scroll to Top