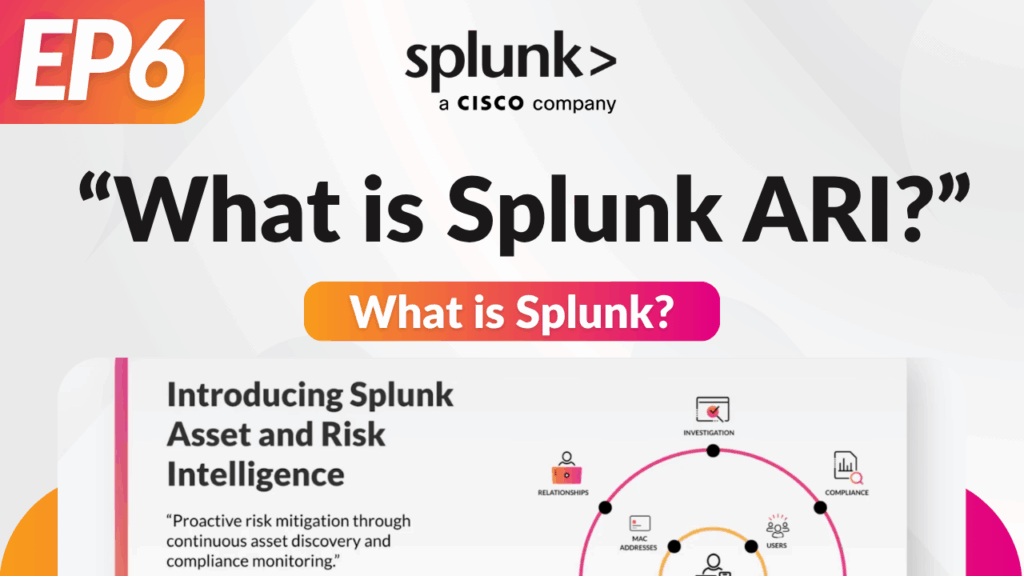
Saul Mulcrow

Splunk for Security: SSE – Data Availability – Episode 3

Video Splunk for Security: SSE – Data Availability Episode 3 Series Overview Video Summary This video focuses on the data availability features of Splunk Security Essentials, which help organisations monitor and address latency issues in their data sources. It begins by demonstrating how to navigate to the data availability dashboard and initialise its machine learning […]

Splunk for Security: SSE – Data Availability – Episode 3 Read More »

Splunk for Security: SSE – Content Introspective – Episode 2

Video Splunk for Security: SSE – Content Introspective Episode 2 Series Overview Video Summary This video introduces Splunk Security Essentials and its content mapping features, highlighting how they help organisations manage and document their deployed content effectively. It begins by demonstrating how to navigate the platform, scan running searches, and match them to relevant use

Splunk for Security: SSE – Content Introspective – Episode 2 Read More »

Splunk for Security: SSE – Series Introduction

Video Splunk for Security: SSE – Series Introduction Episode Trailer Series Overview Video Summary This video is the first in a series showcasing Splunk Security Essentials as an ideal starting point for enhancing security operations with Splunk. It introduces the security data journey, a framework to help organisations focus their security programs, and demonstrates how

Splunk for Security: SSE – Series Introduction Read More »

Splunk O11y Cloud Explained: Log Observer Connect – Episode 5

Video Splunk O11y Cloud Explained: Log Observer Connect Episode 5 Series Overview Video Summary In this video, we explore the capabilities of Log Observer Connect within the Splunk Observability Cloud. We begin by navigating through the service map, where we identify a performance issue with our payment service. By clicking on the service, we seamlessly

Splunk O11y Cloud Explained: Log Observer Connect – Episode 5 Read More »

Splunk O11y Cloud Explained: Infrastructure Monitoring (IM) – Episode 4

Video Splunk O11y Cloud Explained: Infrastructure Monitoring (IM) Episode 4 Series Overview Video Summary In this video, we delve into the infrastructure monitoring component of Splunk Observability Cloud. Starting from the infrastructure dashboard, we observe real-time metrics for various environments, highlighting key insights such as CPU utilisation and instance health across hybrid and multi-cloud architectures.

Splunk O11y Cloud Explained: Infrastructure Monitoring (IM) – Episode 4 Read More »

Splunk O11y Cloud Explained: Real User Monitoring (RUM) – Episode 3

Video Splunk O11y Cloud Explained: Real User Monitoring (RUM) Episode 3 Series Overview Video Summary In this video, we explore Splunk Real User Monitoring (RUM) within the Observability Cloud. Starting from the application summary dashboard for the “webinar store” application, key metrics, such as page views and JavaScript errors, are showcased, which are grouped by

Splunk O11y Cloud Explained: Real User Monitoring (RUM) – Episode 3 Read More »

Splunk O11y Cloud Explained: Application Performance Monitoring (APM) – Episode 2

Video Splunk O11y Cloud Explained: Application Performance Monitoring (APM) Episode 2 Series Overview Video Summary This video provides an overview of Splunk Application Performance Monitoring (APM), part of the Splunk Observability Suite. APM offers distributed tracing to help pinpoint issues within microservices, along with dynamic service mapping that visually outlines service interactions, dependencies, and performance

Splunk O11y Cloud Explained: Application Performance Monitoring (APM) – Episode 2 Read More »

Splunk O11y Cloud Explained: Synthetic Monitoring – Episode 1

Video Splunk O11y Cloud Explained: Synthetic Monitoring Episode 1 Series Overview Video Summary This video introduces synthetic monitoring within Splunk Observability, showcasing how it enables organisations to track uptime, performance, and create dashboards to report on SLAs for availability. Synthetic monitoring helps optimise user journeys by evaluating and improving page speed and functionality across all

Splunk O11y Cloud Explained: Synthetic Monitoring – Episode 1 Read More »

Lacework Explained Resources and Polygraphs

Lacework FortiCNAPP Explained – Resources and Polygraphs – Episode 6

Video Lacework Explained – Resources and Polygraphs Episode 6 Series Overview Video Summary This video explores the complexities of managing and securing a growing array of cloud resources, focusing on the benefits of centralised visibility and advanced analytics. As organisations face the challenge of tool sprawl across multi-cloud environments, having a unified platform to monitor

Lacework FortiCNAPP Explained – Resources and Polygraphs – Episode 6 Read More »

Lacework FortiCNAPP Explained – Dashboard and Alerts – Episode 5

Video Lacework FortiCNAPP Explained – Dashboard and Alerts Episode 5 Series Overview Video Summary This video provides an overview of cloud security alerting, highlighting the challenges of traditional rule-based systems that often result in overwhelming volumes of alerts. It introduces a more efficient approach using anomaly detection, where machine learning identifies suspicious activity by learning

Lacework FortiCNAPP Explained – Dashboard and Alerts – Episode 5 Read More »

Scroll to Top