
Grafana Cloud: Observability and Visualisation Made Easy (4 Pillars of Observability Part #1)
Author: Oscar Moores
Release Date: 20/01/2026
What is Grafana?
When I first discovered Grafana Cloud I looked at what was in front of me and thought to myself: "That's a pretty cool way of visualising data”. I hooked up an influxDB database, one of the many sources you can get data from in Grafana and thought I'd found a nifty visualisation tool with a generous free trial that I could use in my personal projects.
Here is a link to a Grafana free trial: https://grafana.com/pricing/
Only now do I realise how much I underestimated Grafana by not digging that little bit deeper and learning about the entire ecosystem of tools Grafana has to offer. Grafana is a visualisation and observability tool, allowing you to hook up a range of already existing data stores such as Postgresql databases, AWS Aurora and even Splunk. You can then create dashboards that you populate with the many different visualisations Grafana has to offer powered by querying your data. But Grafana isn’t just about using data you already have.

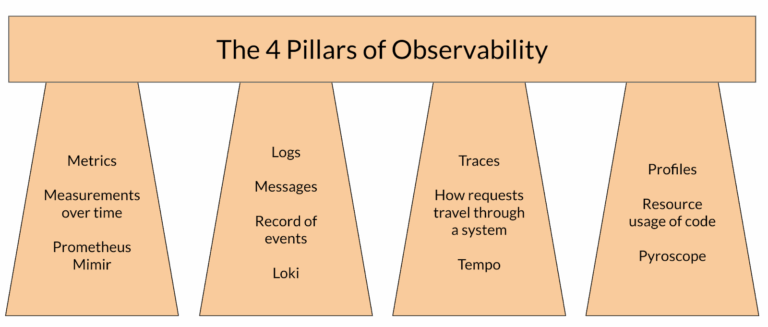
The Grafana stack - a set of tools for end to end collecting, storing and analysing metrics, logs, traces and profiles in a cost effective and scalable way:
• Grafana Alloy - An incredibly easy open telemetry compatible way to collect and process telemetry data
• Mimir and Prometheus for long term metrics storage
• Loki, Tempo and Pyroscope let you store logs, traces and profiles
And atop the Grafana stack sits Grafana Cloud itself, brimming with features designed to let you take distributed infrastructure and truly understand what is going on inside it: Observability.
Observability and Why it Matters
Visualisation is an easy concept to understand, taking information and displaying it in a way that you can understand just by looking at it: Graphs, gauges, statistics displayed in a myriad of colors designed to make understanding data easy at a glance. So when the phrase “Grafana is a brilliant tool for visualisation” is thrown about, you can hear it and agree wholeheartedly.
Observability, on the other hand, I found a bit harder to grasp. A good lens to look at it through is that of monitoring. When you monitor something you are checking to see how something is doing:
• Is my CPU usage too high?
• How long is my website taking to load?
• Has my server crashed?
Observability is about taking this one step further: Asking why. In some cases the answer may just be “My website is taking ages to load because the server isn’t powerful enough”, something you could probably work out if you are only monitoring your server.
But what if you look at your server and see its resources are barely being utilised? What if the reason has nothing to do with the server itself? What if the slowdown isn’t caused by the server you are monitoring, but by the database the server is connecting to?
When you set up observability with Grafana you can see your website's load time is high and ask why - dig into the other services in your environment and track down what is causing a problem. It lets you make that leap from “my load times are high” to “my load times are high because the database can’t keep up” and lets you get on with actually fixing your problems.
The 4 Pillars of Observability
Knowing what observability can do is one thing but if one is to understand it one must study all its aspects - Which there are traditionally 3 of:
• Metrics are measurements taken from a system over time - telling you when there is a problem and allows you to determine the state of your system
• Logs are messages that tell you what a system is doing - great for finding out why a problem is happening or when an event happened
• Traces are like a record of a request - showing where requests are sent, how long parts of the request takes and other useful information about the request - letting you see where a problem is occurring in a request
With these 3 Pillars of observability you can ‘do observability’ quite well. You can visualise performance with metrics, find errors with logs and track down bottlenecks with traces however this does leave one big blind spot: What if the problem isn’t the infrastructure, what if the problem is the code?
The eggheads at Grafana are a step ahead of this potential problem as Grafana does not have 3 Pillars of observability but 4! Profiles are this 4th pillar and allow you to gain more information about the inner workings of an application by monitoring the resource usage and duration down to the function level of an application, filling this gap in observability. They even have fancy visualisations and a database built especially for profiles.

Getting Data into Grafana with Alloy
Previously I stated Grafana wasn’t just about using data you already have and that you could collect data leaving open the question: “How exactly do I get data into Grafana?”. The answer to this question (pretend you haven’t seen the title of the section) is Grafana Alloy.
Grafana Alloy is an OpenTelemetry compatible agent that can be deployed to collect metrics, logs, traces and profiles. When you install an agent you can configure it locally, it is able to scrape from files and endpoints to gather whatever it needs and then send everything to their appropriate backend be that Prometheus, Loki or any of Grafana's other storage solutions. Processing is also possible in Alloy, you can reformat or transform values and labels to clean or organise data to get as much value in Grafana with minimal effort.
Another useful feature that is worth mentioning in relation to Grafana Alloy is fleet management, which is a centralised way to monitor each instance of Alloy as well as apply configuration based on the characteristics of whatever each Alloy instance is being run on. Troubleshooting is made much easier by this as you can view the metrics and logs of an Alloy instance in one location and don’t have to configure each instance to send their own logs and metrics to Grafana.
Alloy is a reliable and versatile tool for collecting telemetry and whenever trying to get metrics, logs, traces and profiles to send to their appropriate backends, Grafana Alloy is most likely what you will use, with additional features like clustering to increase availability and a built in UI for troubleshooting.
Link to Alloy documentation with references for how to use Alloy for the full Grafana stack: https://grafana.com/docs/alloy/latest/
Grafana Cloud: An End to End Observability Stack
In this blog post, I have covered a lot of features and concepts that start to give an idea of why Grafana Cloud is such a good tool for observability. Individually each of these parts sounds great, but explaining how Grafana Cloud fits these together creates a big picture view showing how each of these features complement each other and morph into a 5 star, gold standard platform for end-to-end observability.
Grafana Cloud, hosted and fully managed lets you create dashboards choc-full of visualisations so you know what's going on in a system. It has various other features that let you drill down into your data and explore it to root out the cause of problems quickly.
The 4 Pillars of Observability encompass all the data you need to create an observable system and the Grafana stack gives you the tools to store this data, but what I haven’t mentioned: Grafana Cloud comes with fully managed Prometheus, Loki, Tempo and Pyroscope instances. So Grafana Cloud manages storing your data and gives you all you need to use it. The only thing left is to collect the data. And with Grafana Alloy you can do that easily, just install it where you want to collect any metrics, logs, traces and profiles then configure it, point it at the data and point it at where you want the data stored.
This all only covers a fraction of Grafana’s capabilities. In future blog posts in this series, I am going to dive into a bit more of what Grafana can do!
