How to get the best out of Splunk Real Time Searches
Author: Laurence Everitt
Date: 02/09/22
In this blog post, I’m going to discuss a recurring issue that we have seen on a number of occasions- Splunk in Real Time – and by that I mean Alerts, Dashboards, Reports and Searches that are set to run in real time, and the problems that can be caused by misunderstanding how and when to use these in real time.
I quite like Real Time (RT) searches when they are used in the right way, but not when they are misunderstood and misused. Real time searches are intended to be used for monitoring data in the short term and for checking if and/or when something is happening.

The Problem
The problem is that some people like Splunk real time searches too much and use them a lot! Real-time access to your logs is one of the great things about Splunk! Unfortunately, real time searches are use too frequently, for example when:
- Detecting an error on a web server and showing you that it has a (big?) problem
- Showing you when an urgent/important/high priority email has been received by the Service Desk
- Indicating that a SQL Server is running out of disk space
All of these use cases are great and valid for alerts and dashboards, but when real time searches are used for them, they can destroy whole Splunk implementations by placing great demands on the system. To illustrate why I abhor the misuse of real time Searches, let’s look at a fictional, but realistic, company that uses Splunk – Rhododendron Games.
The Situation
Rhododendron Games (RG) use Splunk to monitor their SQL Server, Service Desk, and Web Servers, and prevent little issues becoming big company/customer problems.
However, in the various, siloed departments, no one really wants to sit down and watch real time a search running through for rare events? So the following happens:
- Database Architect, Peter creates a RT Alert for the disk space on each SQL Server
- Help Desk Manager, David, also sets up a dashboard that itemises (in Real Time):
- Number of urgent, important and high-priority live Service Desk tickets
- Number of currently-waiting people on the phone
- Subject names of the 10 latest incidents
- There is a problem with the company website that needs to be fixed pronto, so the software developers, Sandy, Simon, and Jean, are troubleshooting what is going wrong and are each running their own RT searches to monitor the system.
At this point, everyone is doing what they think is right because detecting issues is what Splunk is used for, right?
The Consequences
However, one or more of a number of issues may start to crop up with RG’s Splunk:
- SplunkWeb becomes slow to respond to any requests
- Other users’ simple ad hoc searches start running slow or are cancelled
- Enterprise Security shows that its Correlation Searches are being skipped (or ES stops responding completely)
- Summary indexes are not being populated or are being populated sporadically because of skipped searches
- Data Models do not populate correctly due to failed or skipped searches
- The dashboards show Search Failed errors, or even become blank
- Events are delayed, or do not appear when they used to
- Influxes of data start to take a long time to be indexed
NOTE: These are example issues as seen on our customers’ systems and they might be happening to yours if you are using multiple RT searches.
Searching for the Root Cause
Due to obvious indicators that Splunk’s hardware is struggling, Jill, RG’s Splunk administrator, checks the specifications of the system and sees:
- 1 Search Head with 12 CPUs and 12GB RAM
- 2 Indexers with 12 CPUs and 12GB RAM and 5TB SAS Drives
Nothing unusual there, but what is causing these issues?
She contacts the Somerford Associates Support Team and we start to investigate the problem. As part of the examination, two of my questions to Jill are:
“Do you have any real time searches, dashboards or alerts running?”
“Yes, we have a few Real Time Searches; what’s wrong with that?”
Many people don’t realise this, but each Splunk search will use one CPU on the Search Head and on each of the Indexers. Here is a comparison of Normal and RT searches:
Splunk Search | Splunk Real Time Search | Uses 1 CPU on each Search Head and Indexer until the search is complete | Uses 1 CPU on each Search Head and Indexer until disabled and doesn’t surrender its resources |
|---|---|
Reads the events from the disk (index)
|
Receives the events before they are indexed
|
From this we can see, for short bursts of needing to closely monitor our logs, the real time search does work well and provides the results at the cost of 1 CPU per Splunk machine and by delaying even the indexing process by a small amount of time.
If we look at Rhododendron Games’ example above, we can then see where the resources are going.
Search Name |
SQL Server Monitor One – RT Alert search
|
|---|
SQL Server Monitor Two – RT Alert search |
SQL Server Monitor Three – RT Alert search |
Number of Urgent Service Desk Tickets – RT Dashboard search
|
Number of Important Service Desk Tickets – RT Dashboard search
|
Number of High-Priority Service Desk Tickets – RT Dashboard search
|
Number of currently-waiting people on the phone – RT Dashboard search
|
Subject names of the 10 latest Incidents – RT Dashboard search
|
Sandy’s Web Logs Monitor interactive – RT search
|
Simon’s IIS Logs Monitor interactive – RT search
|
Jean’s OS Logs Monitor interactive – RT search
|
Each of these real time searches will use one core on the Search Head and one core on each of the indexers. As the 11 real time searches use 11 cores, all of the other processes, such as the Splunk Application and Operating System, can only run on 1 core! And remember, that CPU utilisation is repeated on Search Heads and Indexers! The result is that if someone else logs onto the Search Head and tries to search anything else (such as the Splunk internal logs to find out what is going on), then they will be waiting for resources; and those might not even be coming at all.
The Solution
So… …we know the problem, what is the fix? Well, the solution is to:
- Convert RT searches to use useful historical searches and
- Only allow certain users to use Real Time searches
Replace those Real-Time Searches!
To get the system working again, the customer needs to convert the RT searches in their various guises to use historical searches. This is easier than most people realise, but requires a little more thought than setting or unsetting a single tick box. Let’s look at two different examples.
Example 1: Real Time Alerts
Currently, the RT search is defined in the savedsearches.conf as:
[Low Disk Space on RGAPPSQL01 E: Drive]
cron_schedule = * * * * *
dispatch.earliest_time = rt-5m
dispatch.latest_time = rt-0m
search = index=sqlserver host=rgappsql01 partition=E: PartitionFreeSpaceMB < 5000 | eval AdministratorEmailAddress=emailaddress, “Available Disk Space”=”Free Space on ” + partition + ” = ” + PartitionFreeSpaceMB | table host, “Available Disk Space”, AdministratorEmailAddress
To change the Alert from using an RT Search to using a historical search, we change these values:
cron_schedule = */5 * * * *
dispatch.earliest_time = -6m@m
dispatch.latest_time = m@m
In SplunkWeb, this looks like:
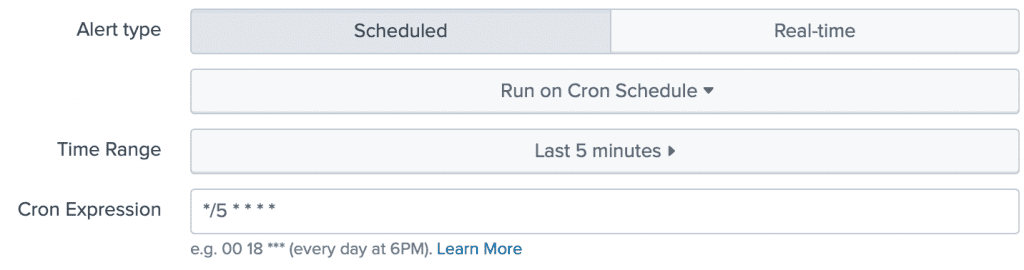
This changes the search period from searching the last 5 minutes in real-time, to running a search every 5 minutes of the previous 5 minutes’ data, which consumes much less resources. Okay, so the alert is now run every 5 minutes and not instantaneously after the situation happens, but after you got the alert, were you going to fix it immediately? No. An at-most 5 minutes’ delay means very little difference to most use cases. If you need better responsiveness, then reduce it down to 1 minute intervals and see how it goes.
Example 2: Real Time Dashboard/Report
To change a Real Time dashboard to run with historical searches is similar to Example 1, but in this example we will be changing the XML in the dashboard itself. Consider this Real Time Help Desk dashboard:

Click the Edit button and then press the “Source” button to see the XML. Below is the Dashboard XML that created this Real Time dashboard.
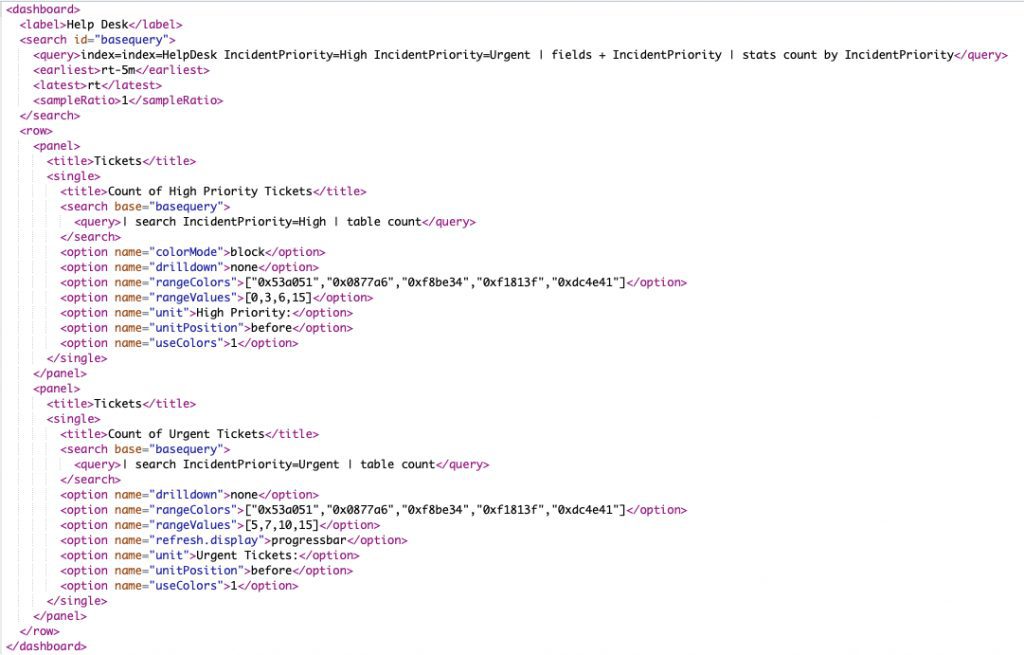
Again, we are searching every 5 minutes, the previous 5 minutes and refreshing every 5 minutes.
Remove The Temptation!
The other half of the issue is stopping (the wrong) people from running Real Time searches and from setting up scheduled RT Searches. As a Splunk Admin, remove the following capabilities from their assigned Splunk Role, by going into SplunkWeb and Settings->(Users and Authentication section)->Roles->[select role name]->Capabilities.
NOTE: Capabilities can also be assigned directly to Splunk Users (but this is not recommended).
Capability | Meaning |
rtsearch
| Providing this capability allows a user to conduct real time searches. |
|---|---|
schedule_rtsearch
| Providing this capability allows a user to schedule real time searches. |
In Conclusion
As you can see from this article:
- There are situations where Real Time searches should be applied
- What can happen when you use Real Time searches incorrectly
- How to modify the real time searches to use historical searches effectively
- How to disable users’ abilities to create and schedule Real Time searches in the future
Don’t get me wrong, real time searches can be powerful but should only be used in the right context, for short periods of time and by the right people – those who need to monitor for problems that are happening, here and now – and not for more general alerting and reporting purposes.