
Getting Okta Data into Splunk (Part 2)
Author: Jamie Turbill
Release Date: 13/07/2021
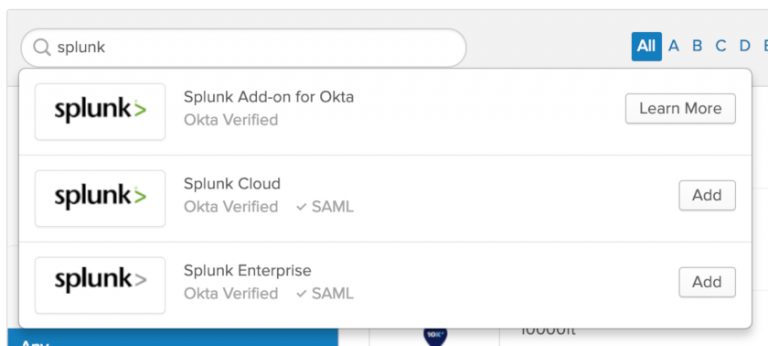
Click on “Splunk Add-on for Okta”. This will provide you with a brief description of the add-on and about some of its features.
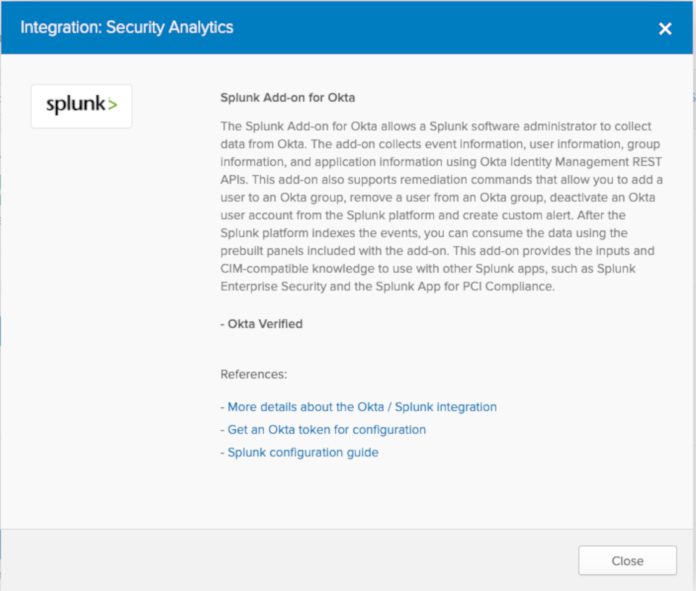
Click on “More details about the Okta / Splunk integration” to be taken to Splunkbase.
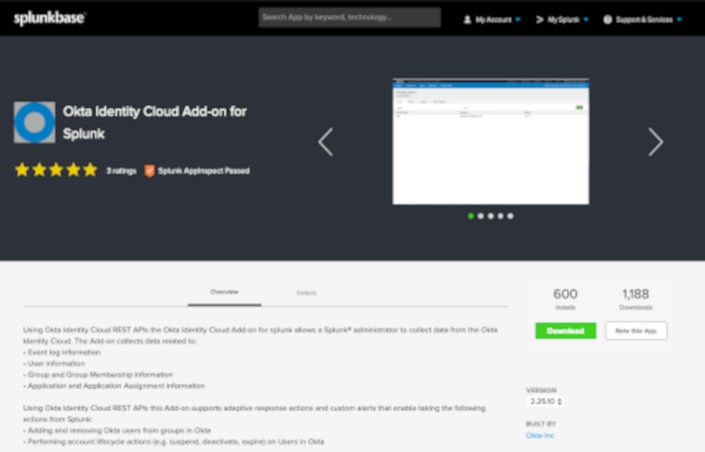
Once on Splunkbase, use the “Download” option to download the add-on for Okta, and then install this as appropriate for your Splunk deployment. This add-on is built and supported by Okta.
Okta provides a complete step-by-step documentation for this add-on here, including all prerequisites and information about where this add-on can and should be installed in your Splunk deployment.
I’m going to cover the setup from the simplest deployment type, an all-in-one Splunk instance, but you should refer to this documentation for your own environment and for anything not covered below.
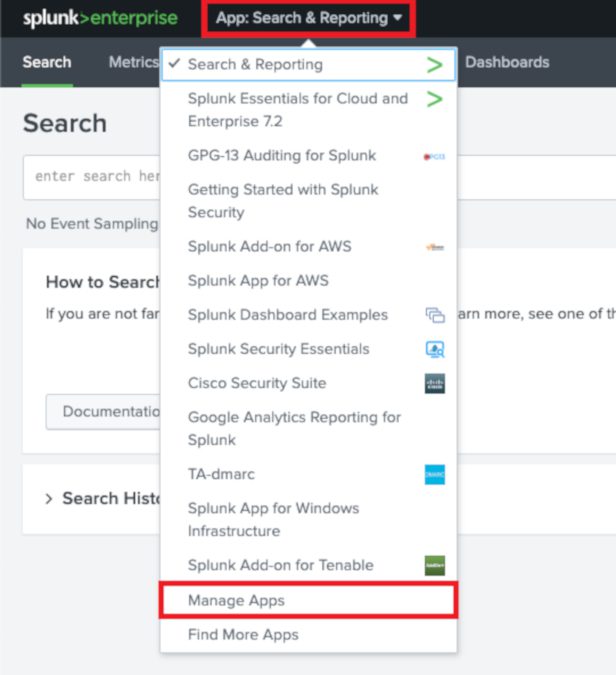
For an all-in-one Splunk instance, you can simply install the application by using the “Upload App” functionality within Splunk Web. In Splunk, from the “Search & Reporting” app, click on “App: Search&Reporting” > “Manage Apps” as shown below:
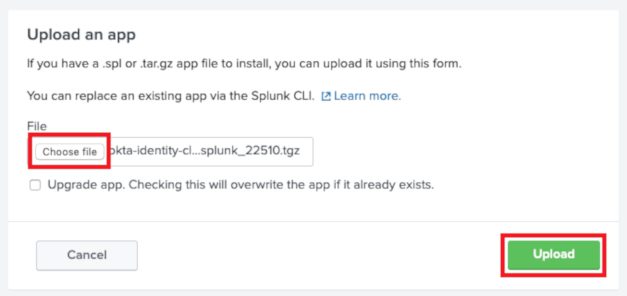
To upload and install the add-on, click on “Install app from file”, Choose File and select the Add-on you downloaded. Then “Upload”
Splunk will now install the add-on. You will be prompted to restart Splunk after installation, do this by clicking on “Restart Now”.
You now need to obtain an API key from Okta to allow Splunk to collect Okta’s system logs and other information from your Okta tenant. Your Splunk instance collecting this data needs to be able to connect to Okta on HTTPS port 443.
To generate an API key, go to your Okta tenant. From the Okta admin portal and click on Security > API > Tokens > Create Token. Then enter a name for the API token. E.g. “Splunk_Prod”
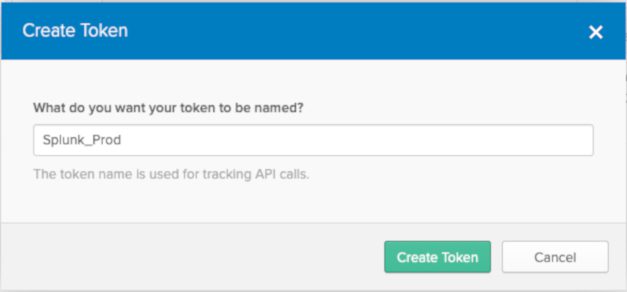
And then “Create Token”. Copy the token generated (this will be needed later). Back in Splunk, go to Apps > Okta Identity Cloud Add-on for Splunk > Configuration > Okta Accounts > Add.
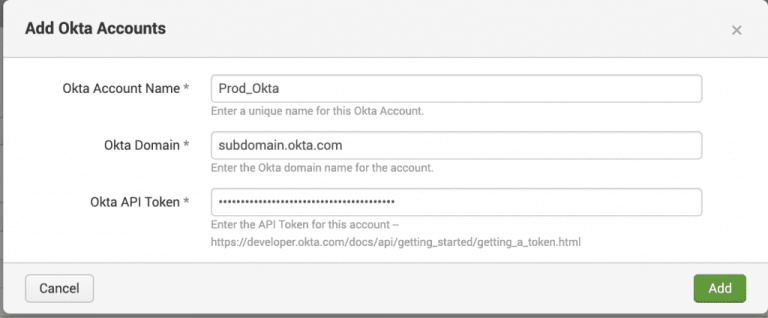
Enter the following:
Okta Account Name (this can be named as required)
Okta Domain (enter your full Okta domain)
E.g subdomain.okta.com
Okta API token (paste in the value that you have copied)
Then click “Add” to save.
Once saved, click on “Inputs” > Create New Input.
We recommend that you create 1 input for each metric type that can be collected. The metric types are:
Logs - Collects Okta System Log Events
Users - Collects User Information (such as user profile, user activity)
Groups - Collects Group Information (such as group membership, group changes)
Apps - Collects App Information (such as app name, SSO/provisioning configuration, assignments etc)
It is best practice to use a separate index for data collection. Create an index if necessary from Settings > Indexes
Use the following when setting up inputs within the add-on:
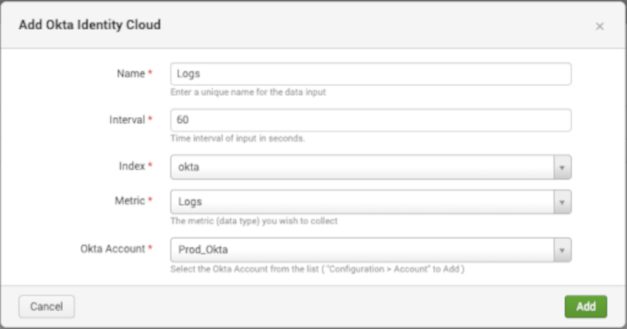
Above: Logs
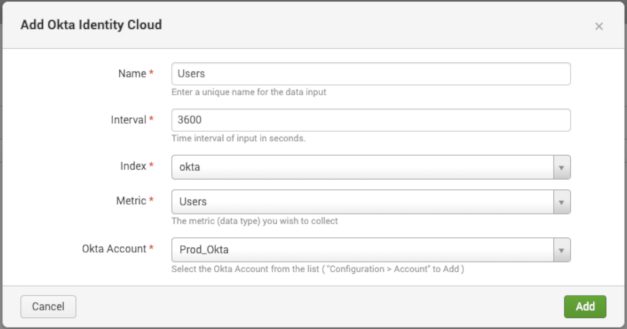
Above: Users
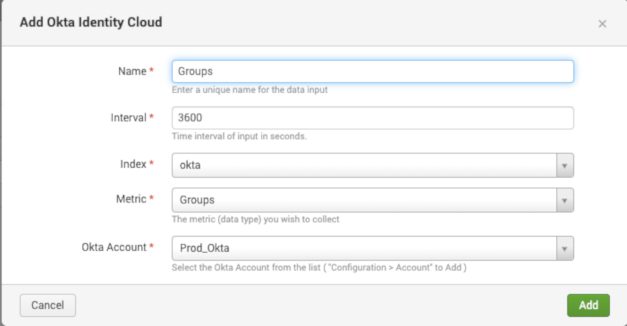
Above: Groups
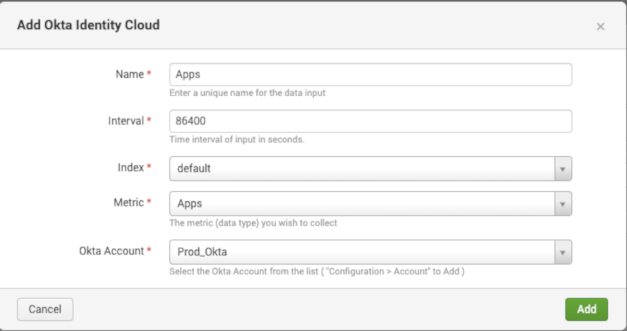
Above: Apps
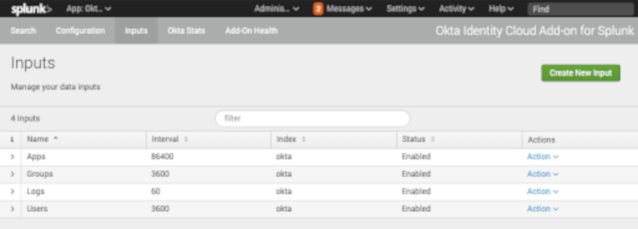
Once all added, your inputs list should look similar to the above.
That should be all that’s required!
Double check you are receiving data. Run a search for “index=okta” and see if you are getting results.
The events that are retrieved should be in a JSON format and should represent the events seen within the Okta system log.
You can now use your Okta data to create dashboards, reports and alerts as per your requirements within Splunk!
Some example dashboards are below that you could create with this data:
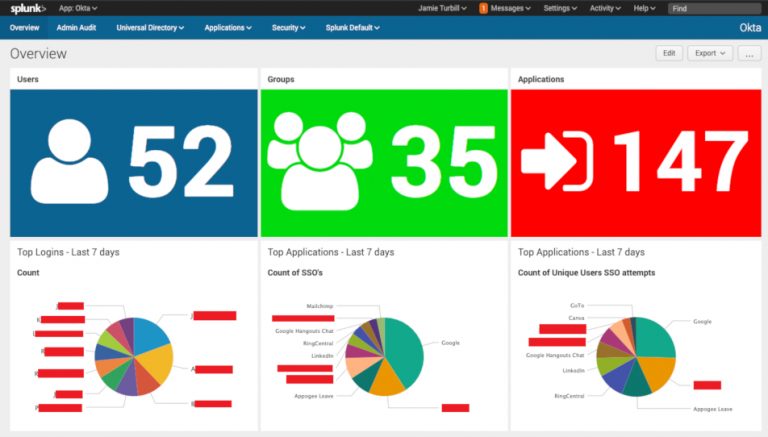
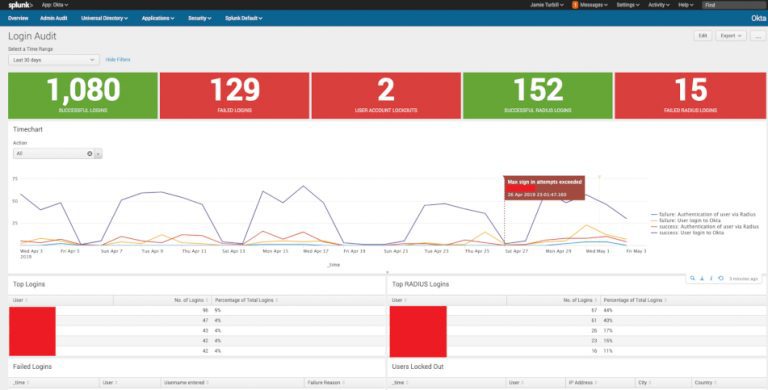
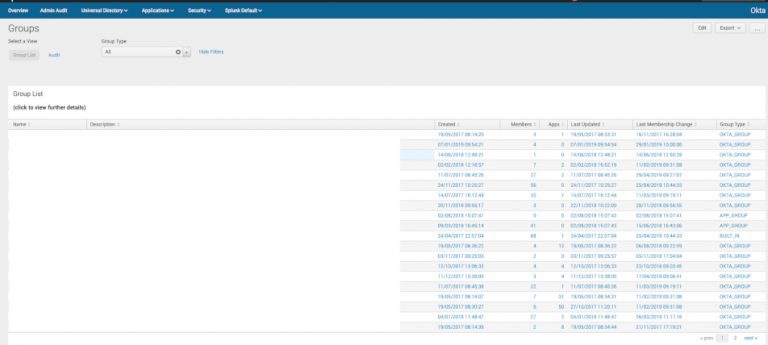
As you can see from the screenshots above, it’s now easy to get complete end-to-end reporting and monitoring of my Okta platform, extending the functionality of the reports and system log available within Okta. This is now in addition to what we covered in Part 1 - where we have easy and seamless SSO access to our Splunk environment.